FIG 5.
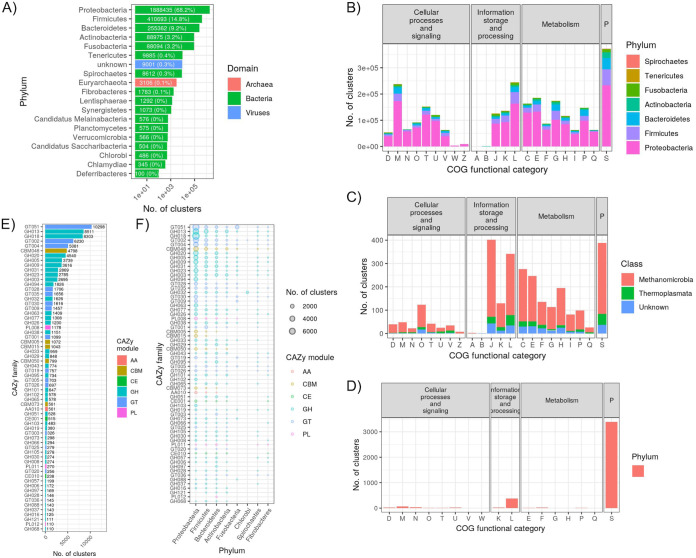
Summary of the 50% sequence identity clusters generated from the gene-based metagenome assembly of the combined data set. (A) Total number of gene clusters per phylum. For clarity, only phyla with ≥100 clusters are shown. Labels on each bar list the number of clusters (and percentage of the total). (B) Number of bacterial gene clusters per phylum and COG category. The “P” facet label refers to “poorly characterized.” (C) Number of archaeal gene clusters per class (all belonging to the Euryarchaeota) and COG category. (D) Number of viral gene clusters per COG category. (E) Number of clusters annotated as each CAZy family. For clarity, only phyla with ≥100 clusters are shown. Labels next to each bar denote the number of clusters. (F) Number of clusters per CAZy family, broken down by phylum. CAZy families and phyla are ordered by most to least clusters. For clarity, only CAZy families and phyla with ≥100 total clusters are shown.

