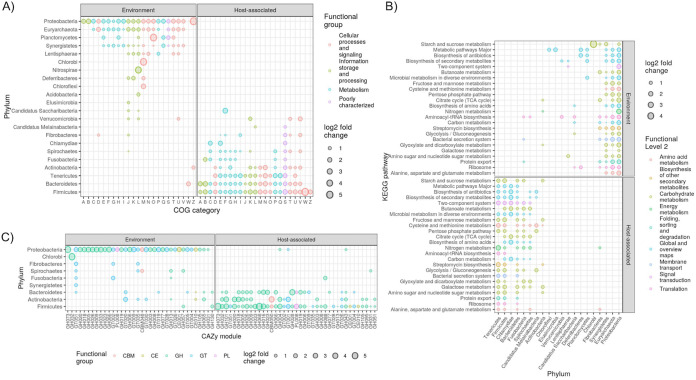
FIG 6.
Enrichment of gene clusters grouped by phylum and COG category (A), KEGG pathway (B), or CAZy family (C). Only groupings significantly enriched in abundance (DESeq2 adjusted P value of <1e−5) in either biome are shown. Only gene clusters observed in at least 25% of the metagenomes were included. For clarity, only KEGG pathways enriched in >7 phyla are shown, and only CAZy families enriched in >1 phylum are shown. Note that the axes are flipped in panel B relative to panels A and C. See Tables S5A to C in the supplemental material for all DESeq2 results. TCA, tricarboxylic acid.

