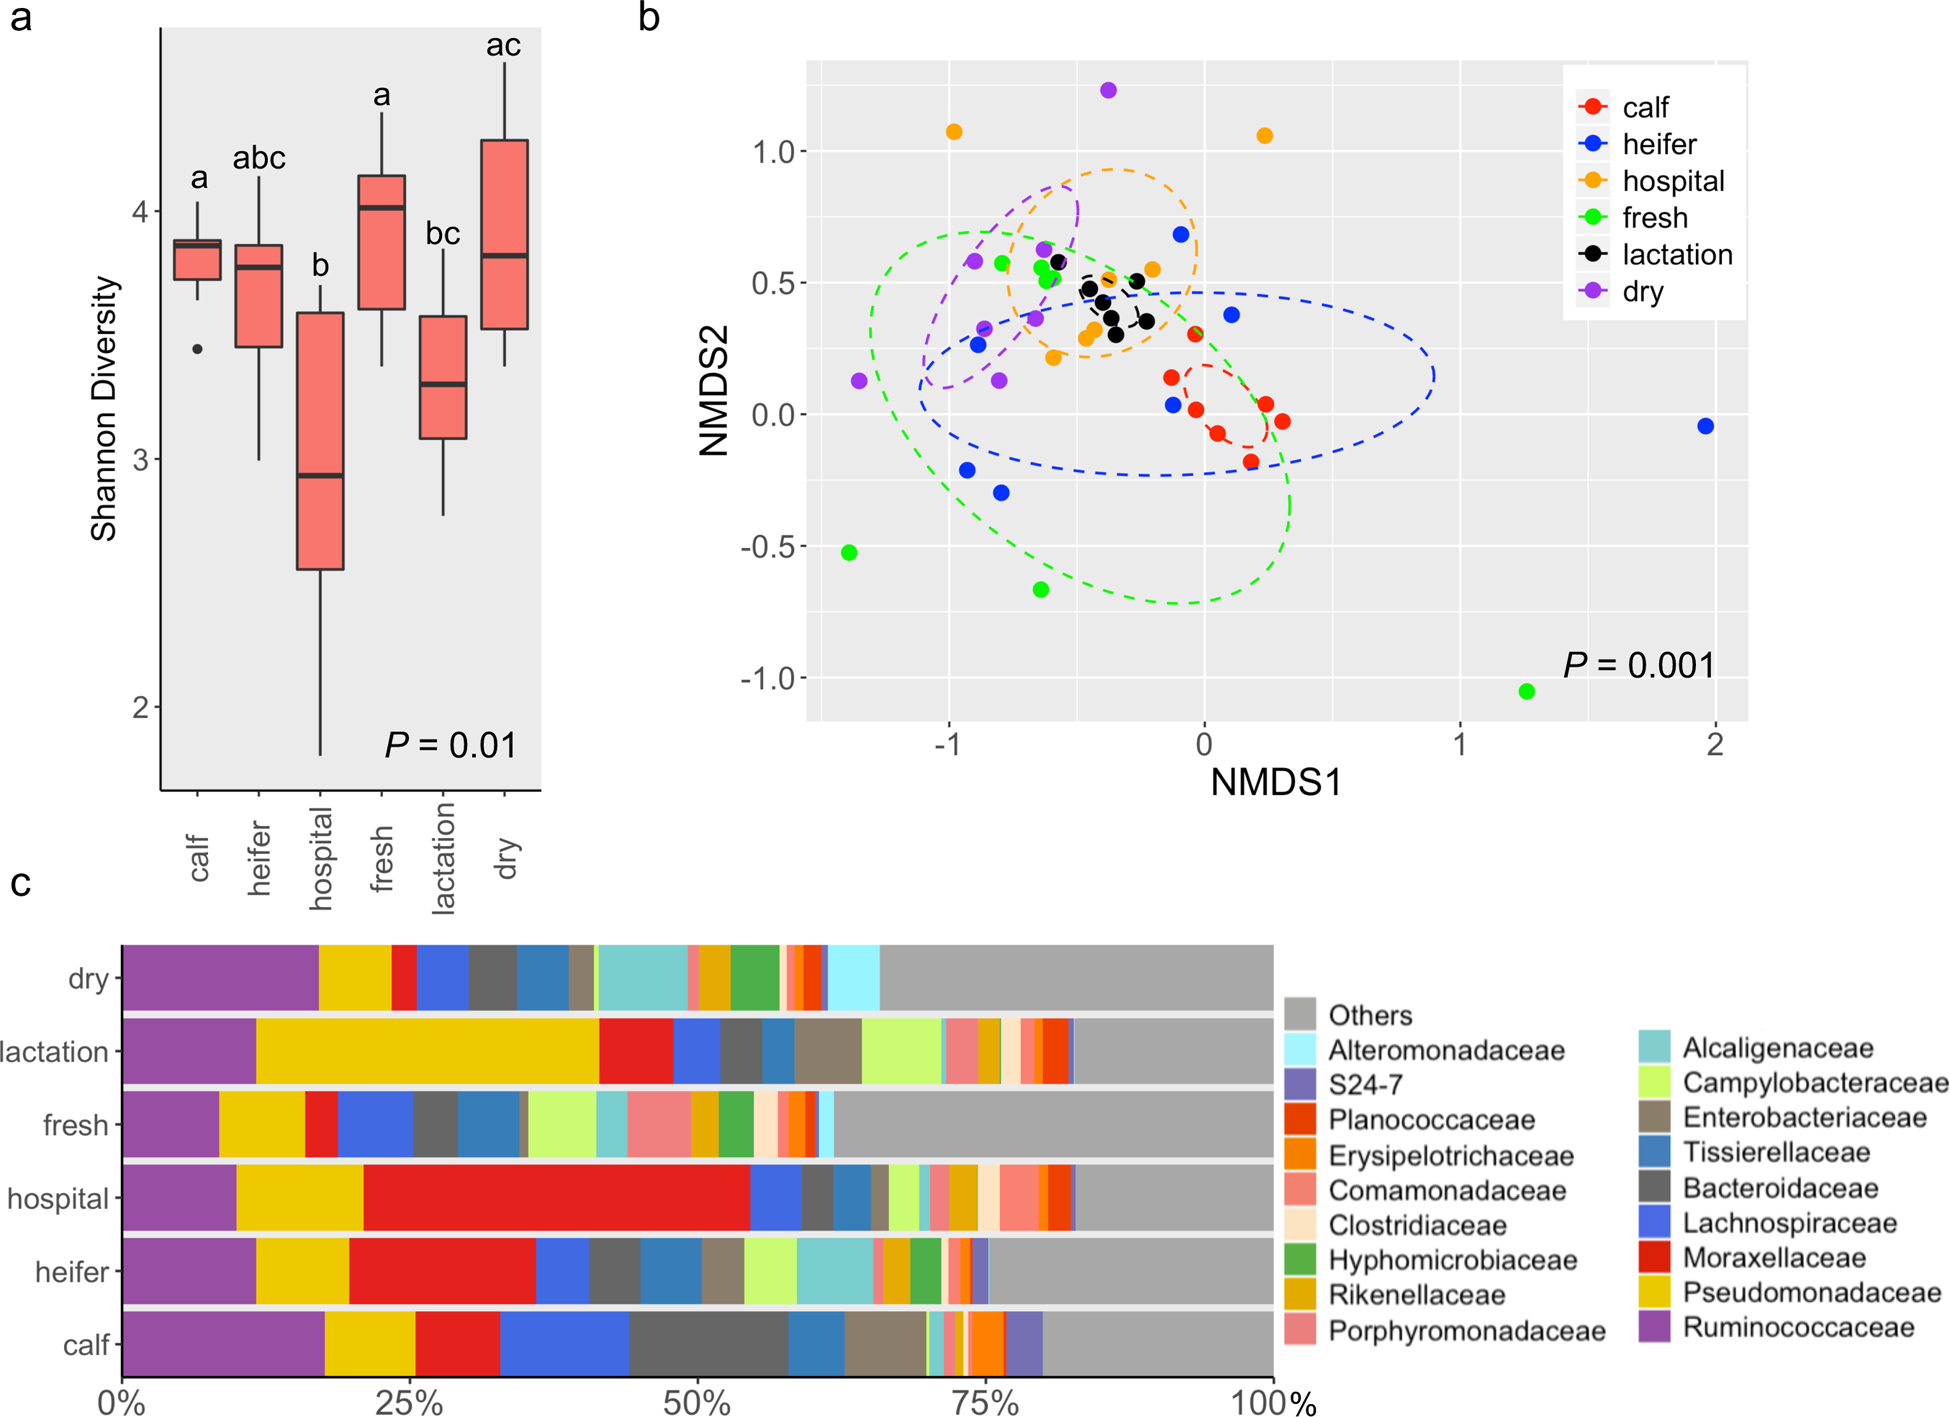
Fig. 1.

The fecal microbiota of dairy cattle differs across housing areas. (a) Boxplots of alpha diversity as measured by Shannon diversity index. The Shannon index values were presented as the median (central black horizontal line); the lower and upper hinges correspond to the 25th and 75th percentiles. Outliers are displayed as small black circles. This design applies to all the following boxplots in this study. The data were analyzed by a Kruskal-Wallis test followed by the pairwise Mann-Whitney U-tests for multiple comparisons. Different letters indicate statistically significant groups. (b) 3-D NMDS of dairy fecal samples based on Bray-Curtis matrices (stress = 0.16). The centroid of each ellipse represents the group mean, and the shape was defined by the covariance within each group; this design applies to all the following NMDS plots in this study. The data were analyzed by PERMANOVA followed by pairwise permutation MANOVAs for multiple comparisons. (c) Bar plot depicting the relative abundance of bacterial families over time; bacterial families which has a relative abundance less than 1% were grouped into “Others”.
