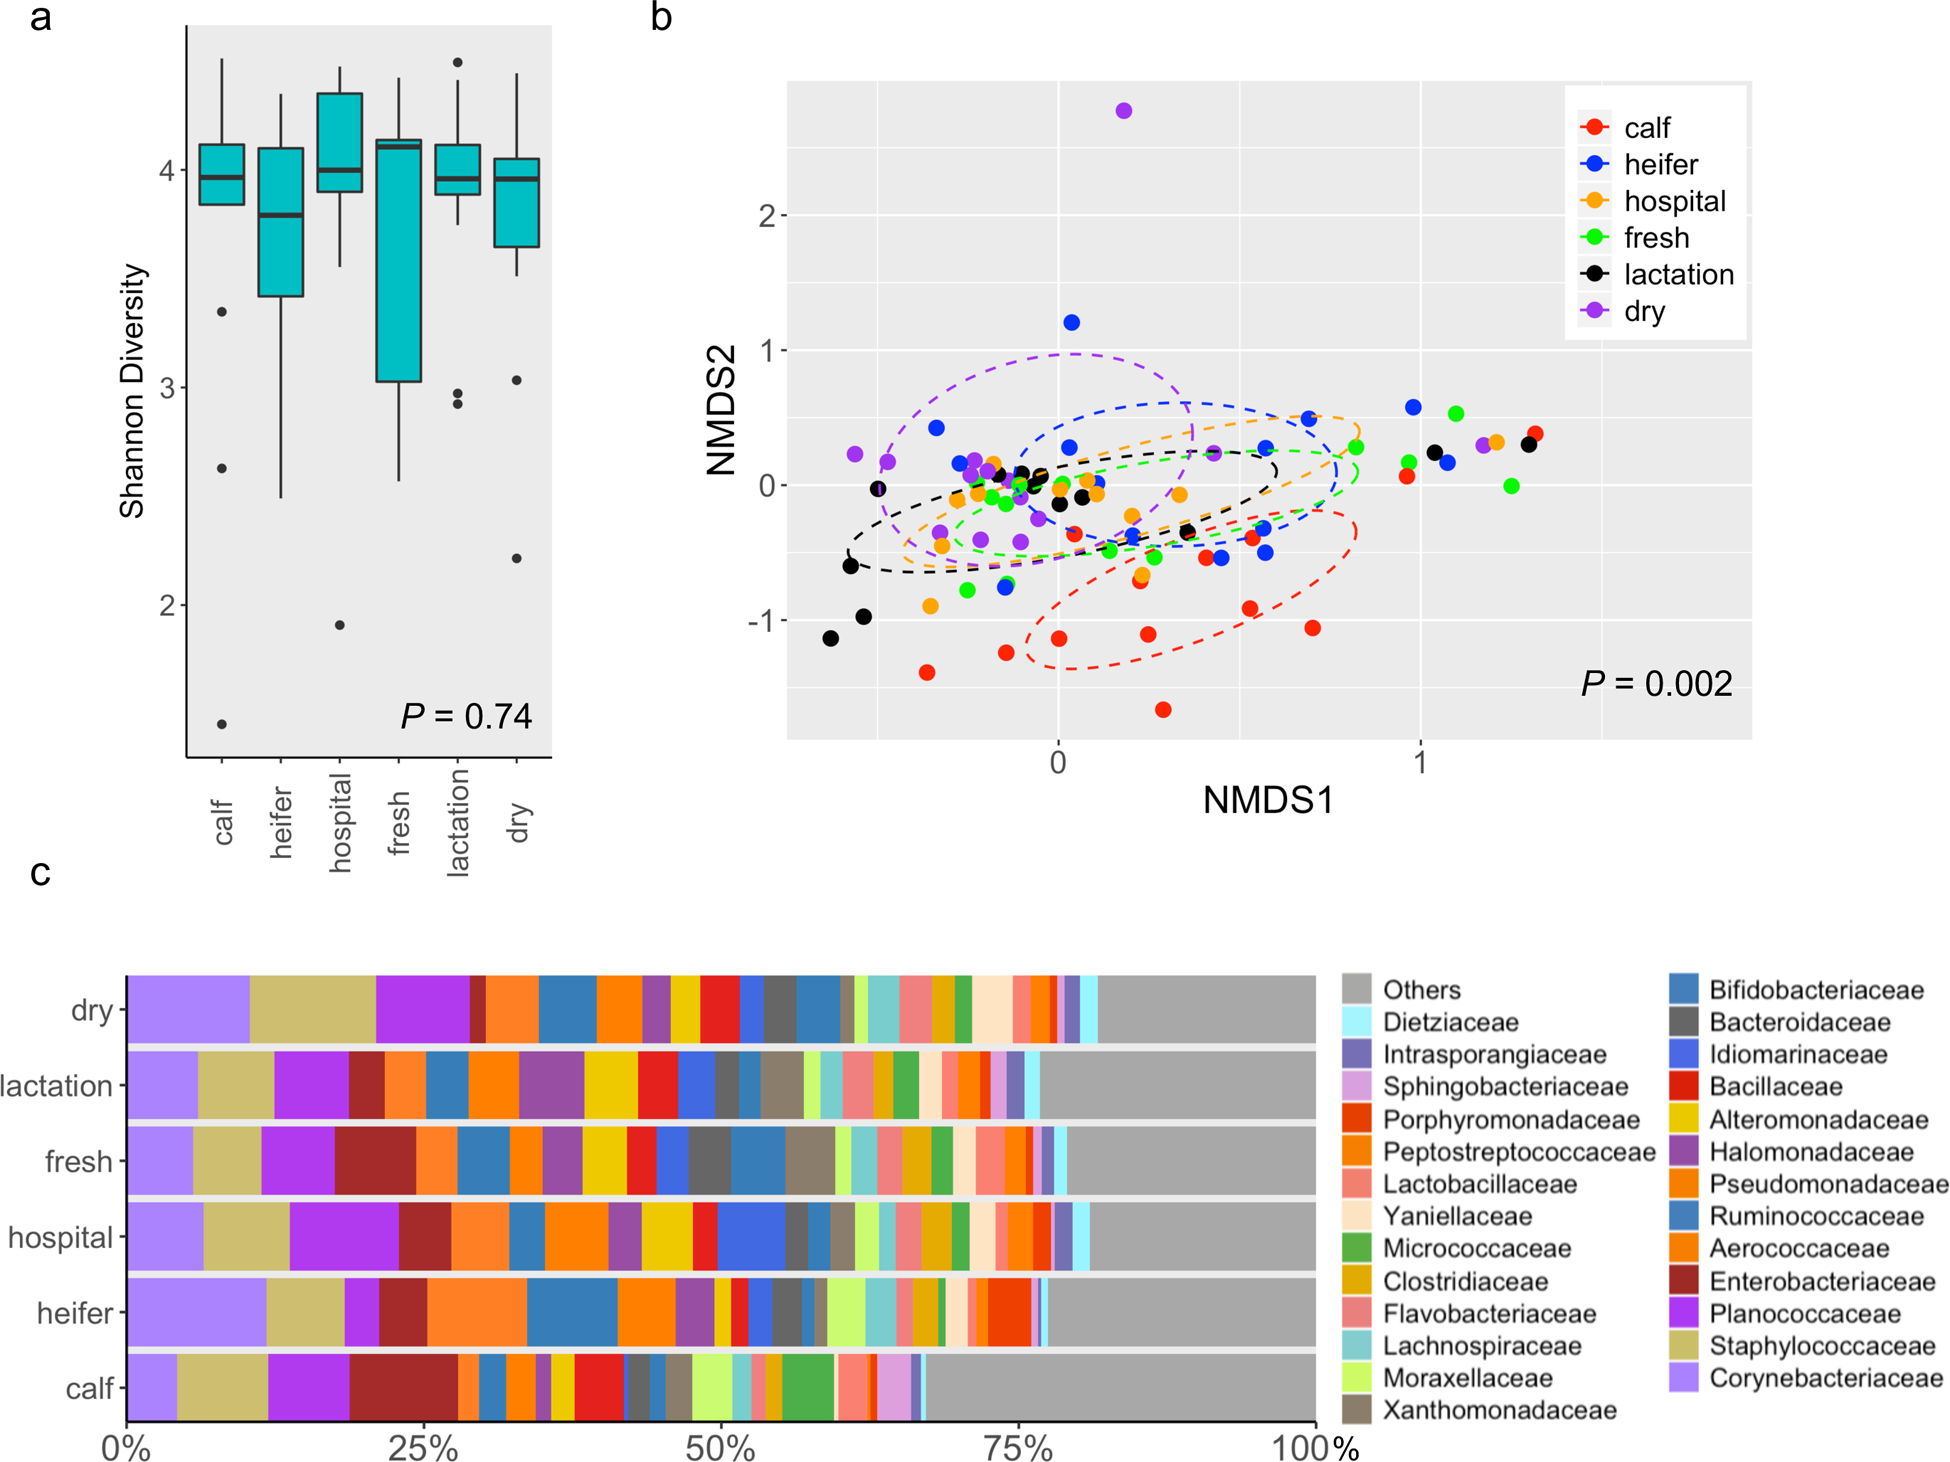
Fig. 2.

The soil microbiota differs across housing areas on dairy farms. (a) Boxplots of alpha diversity as measured by Shannon diversity index. (b) 3-D NMDS of dairy soil samples based on Bray-Curtis matrices (stress = 0.14). (c) Bar plot depicting the relative abundance of bacterial families over time; bacterial families which has a relative abundance less than 1% were grouped into “Others”.
