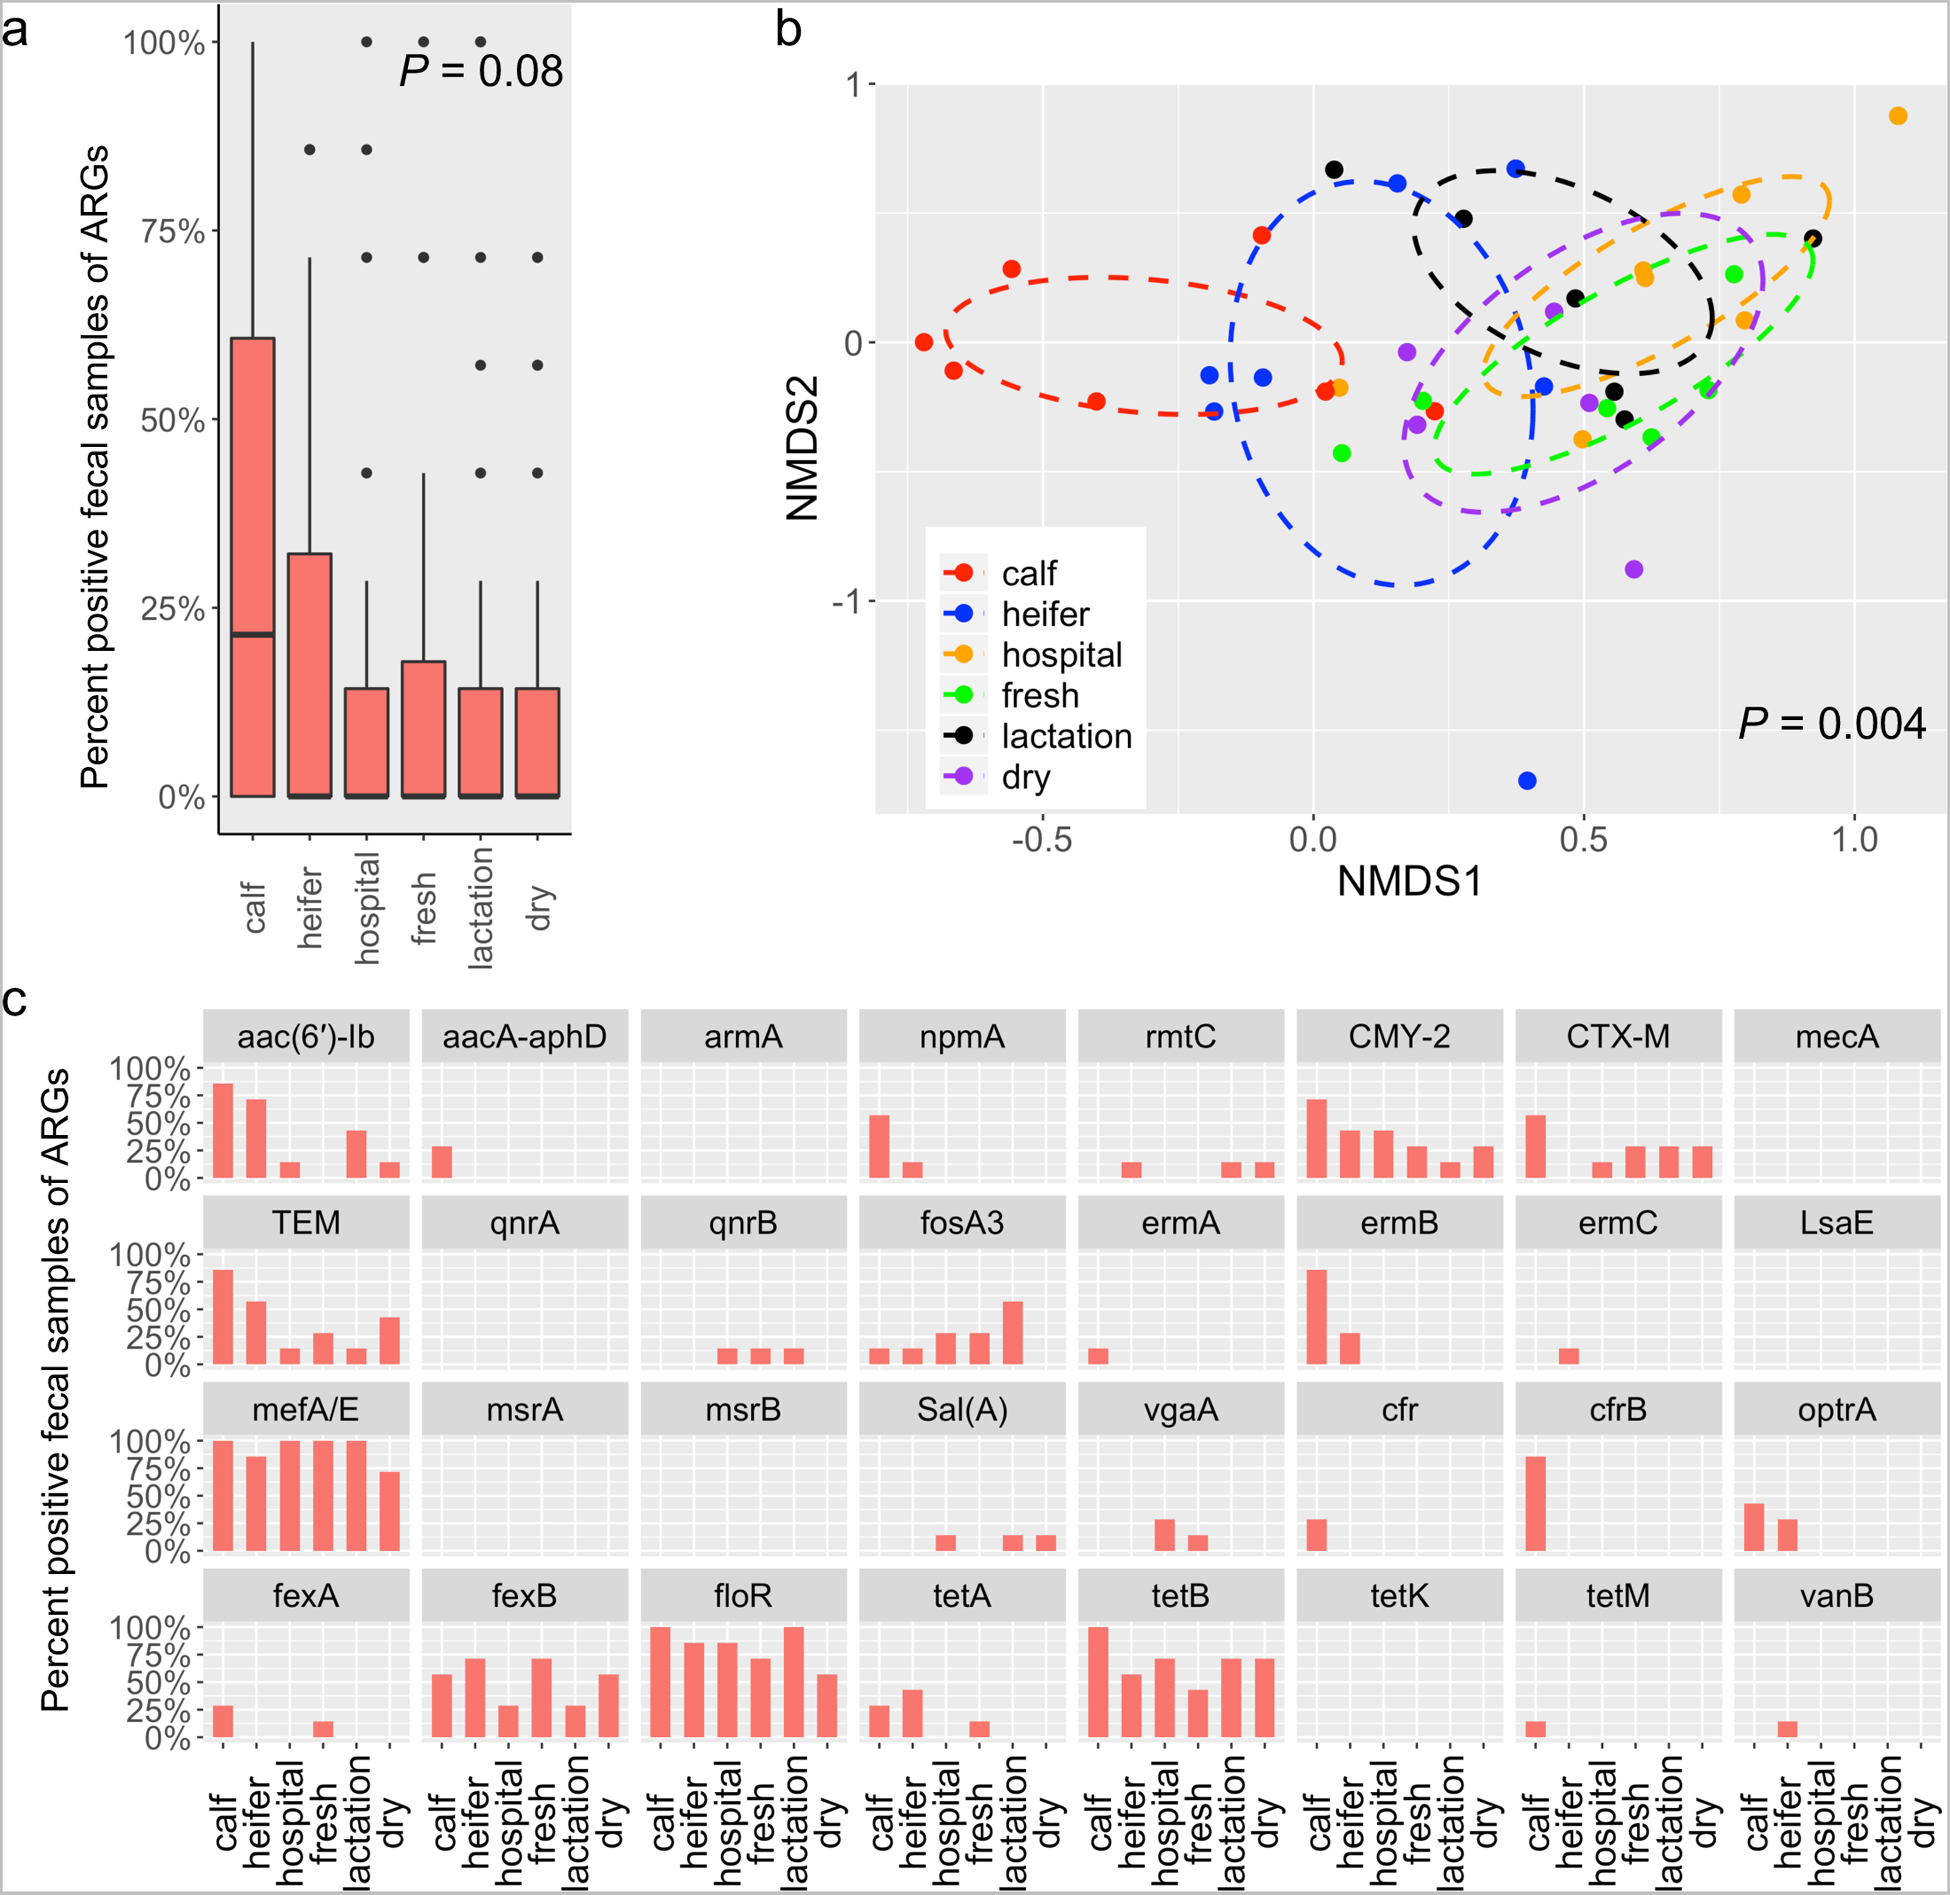
Fig. 3.

The prevalence of targeted ARGs in fecal samples vary across housing areas. (a) Boxplots of detection rate of ARGs grouped by housing regions. The detection rate was calculated as the ratio of PCR-positive samples divided by total samples. This was applied to all the following analyses in this study. (b) 3-D NMDS ordination of fecal samples based on Jaccard matrices (stress = 0.13). (c) Bar plot depicting the detection rate of individual ARGs across housing areas.
