
Fig. 4.
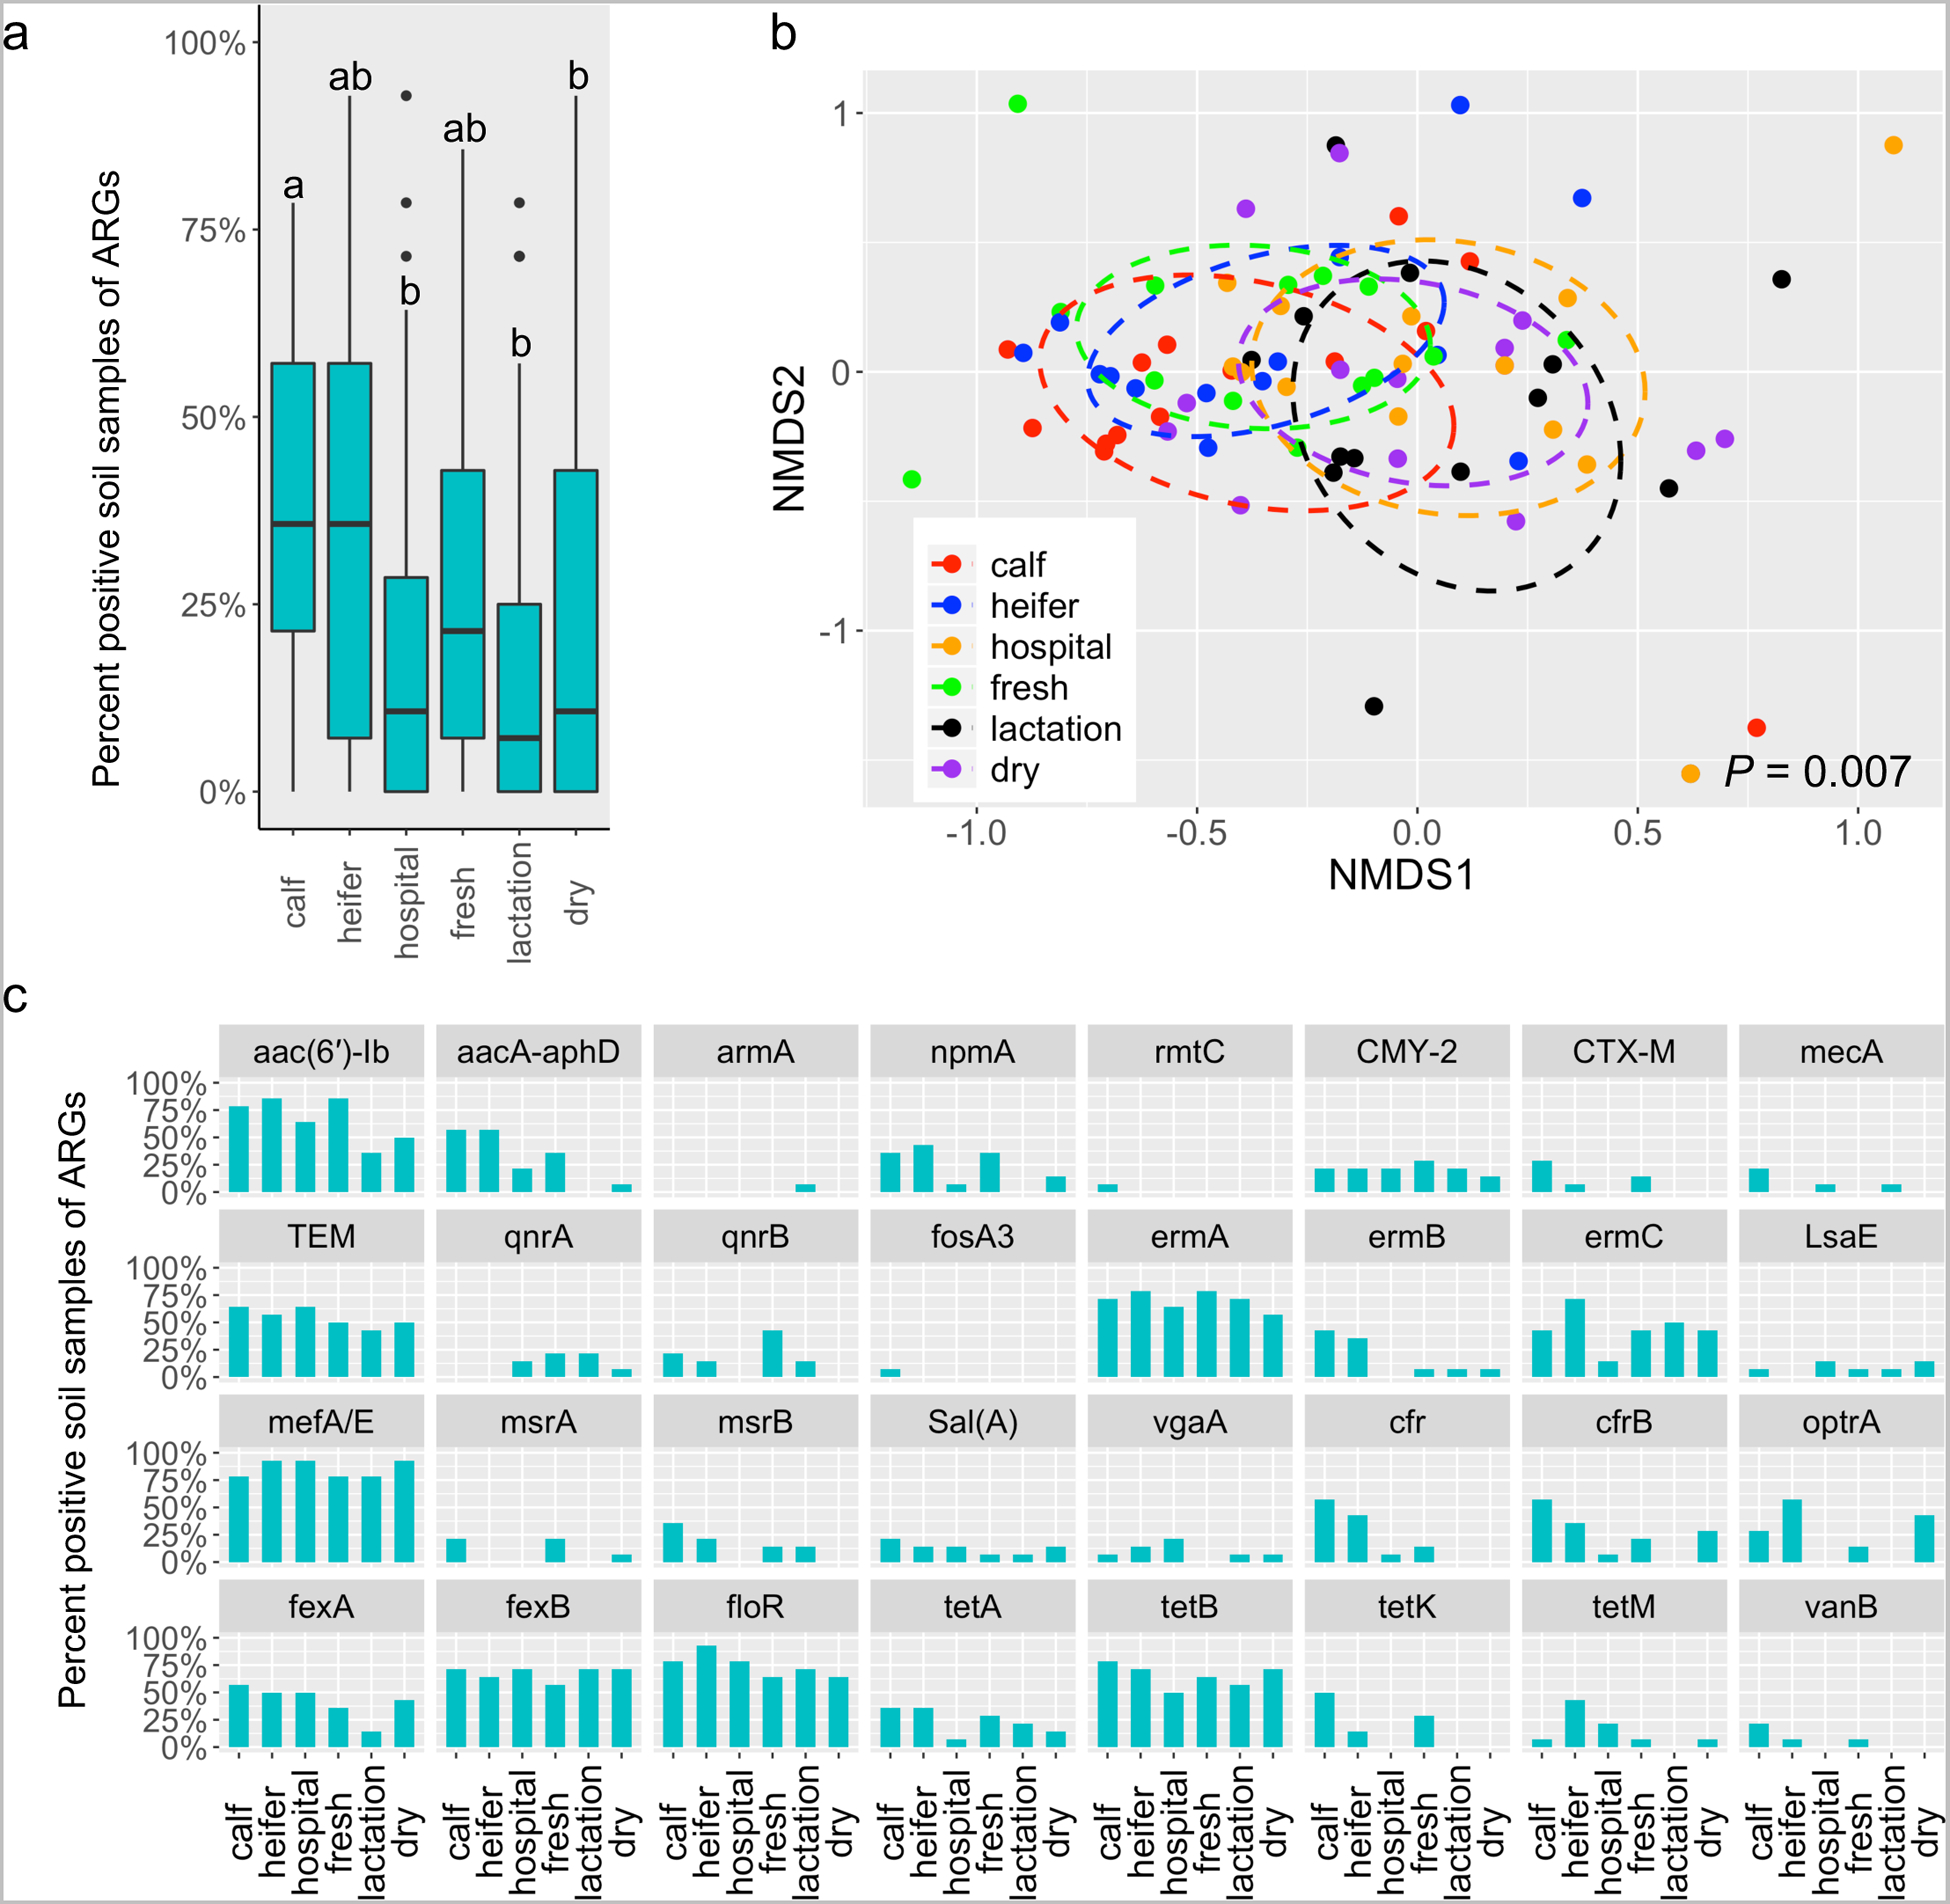
The prevalence of targeted ARGs in soil samples vary across housing areas. (a) Boxplots of detection rate of ARGs grouped by housing regions. Different letters indicate statistically significant groups. (b) 3-D NMDS ordination of soil samples based on Jaccard matrices (stress = 0.14). (c) Bar plot depicting the detection rate of individual ARGs across housing areas.