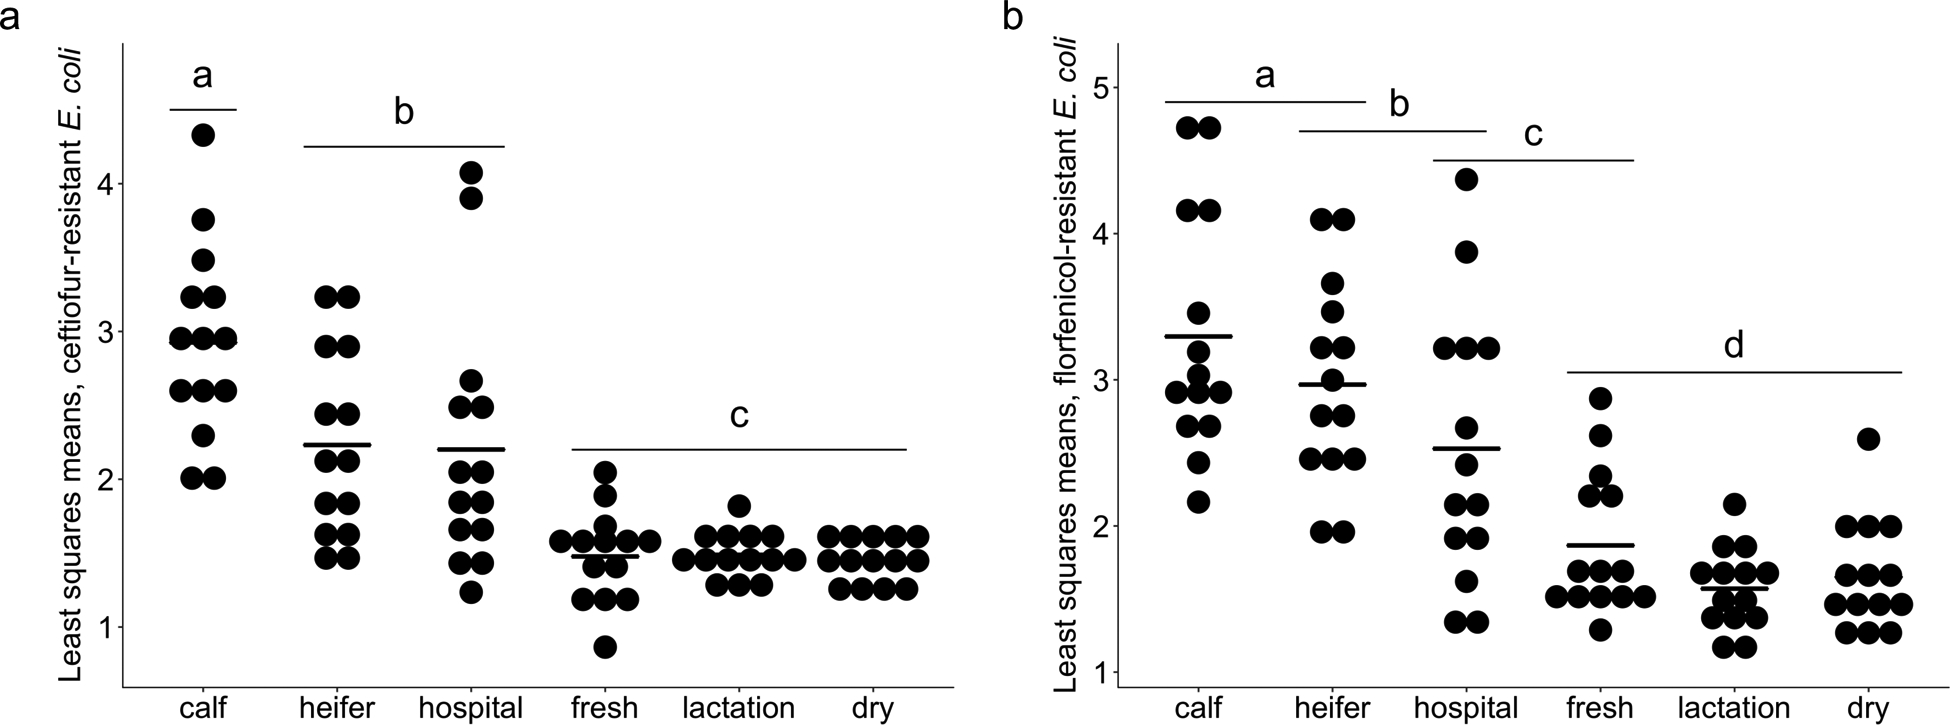
Fig. 6.

Least-squares mean Log10 CFU counts for (a) ceftiofur-resistant and (b) florfenicol-resistant E. coli. Dots represent individual farms and bolded line segments represent least-squares mean for housing type. Different letters indicate statistically significant groups based on a Tukey-Kramer multiple comparison test (P < 0.05).
