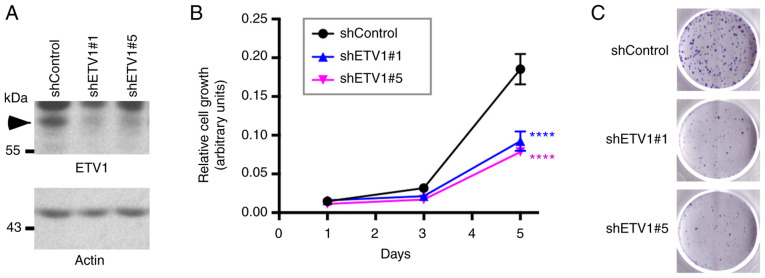
Figure 1.
Effect of ETV1 on HCT116 colorectal cells. (A) Downregulation of ETV1 with two different shRNAs in HCT116 cells was evaluated by western blot analysis. Arrowhead points to ETV1. (B) Analysis of HCT116 cell growth. Statistical significance was assessed with two-way ANOVA with post hoc Dunnett's multiple comparisons test; n=3; ****P<0.0001 vs. control. (C) Clonogenic assay. Representative images from 3 independent experiments.

