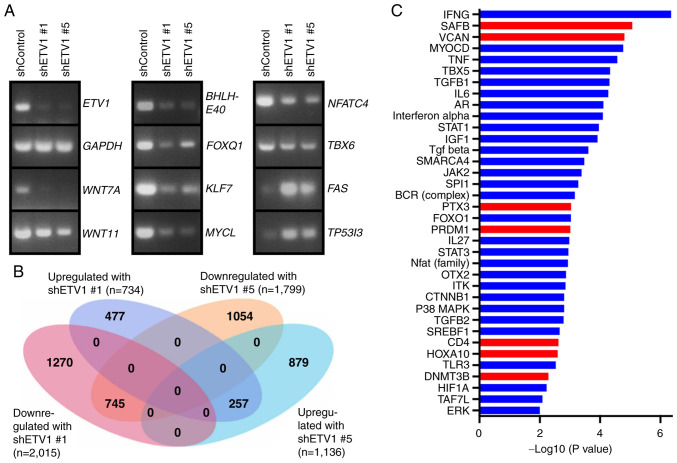
Figure 6.
RNA-sequencing analyses. (A) RT-qPCR analyses showing mRNA levels of indicated genes in HCT116 cells expressing control shRNA, shRNA ETV1 #1 or shRNA ETV1 #5. (B) Venn diagram depicting genes that were >2-fold up- or downregulated in HCT116 cells upon expression of the two different ETV1 shRNAs compared to control shRNA. (C) Ingenuity Pathway Analysis for upstream regulator pathways. Blue color indicates inhibition and red color activation in the presence of ETV1 shRNAs. Inclusion criteria were the following: i) Absolute value of the activation z-score was larger than 1.5, and (ii) P-value of overlap <0.01.

