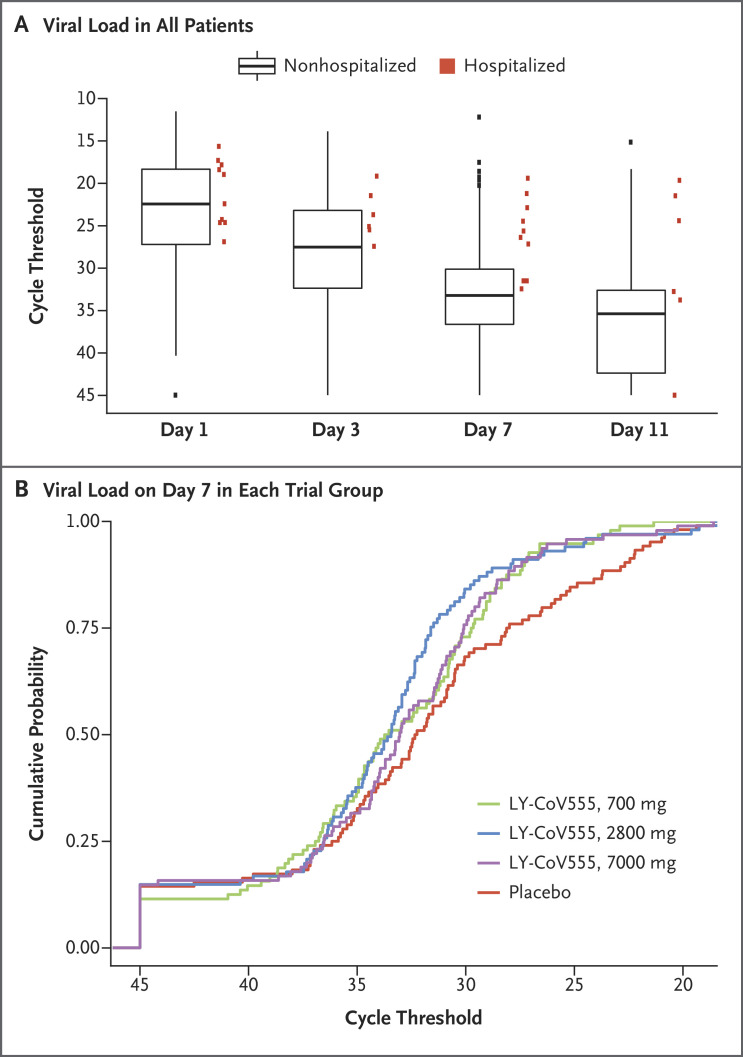
Figure 2. SARS-CoV-2 Viral Load in All Patients and According to Trial Group on Day 7.
Panel A shows the SARS-CoV-2 viral load (as measured by the cycle threshold on reverse-transcriptase–polymerase-chain-reaction assay) for all the patients who received either LY-CoV555 or placebo and for whom viral-load data were available at the time of the interim analysis. The box plots indicate the patients who were not hospitalized, and the red squares indicate those who were hospitalized. Such hospital contact was found to be associated with a high viral load on day 7. The boxes represent interquartile ranges, with the horizontal line in each box representing the median and the whiskers showing the minimum and maximum values (excluding outliers that were more than 1.5 times the values represented at each end of the box). Panel B shows the cumulative probability that patients in each trial group would have the indicated cycle threshold of viral load on day 7.

