
FIGURE 3.
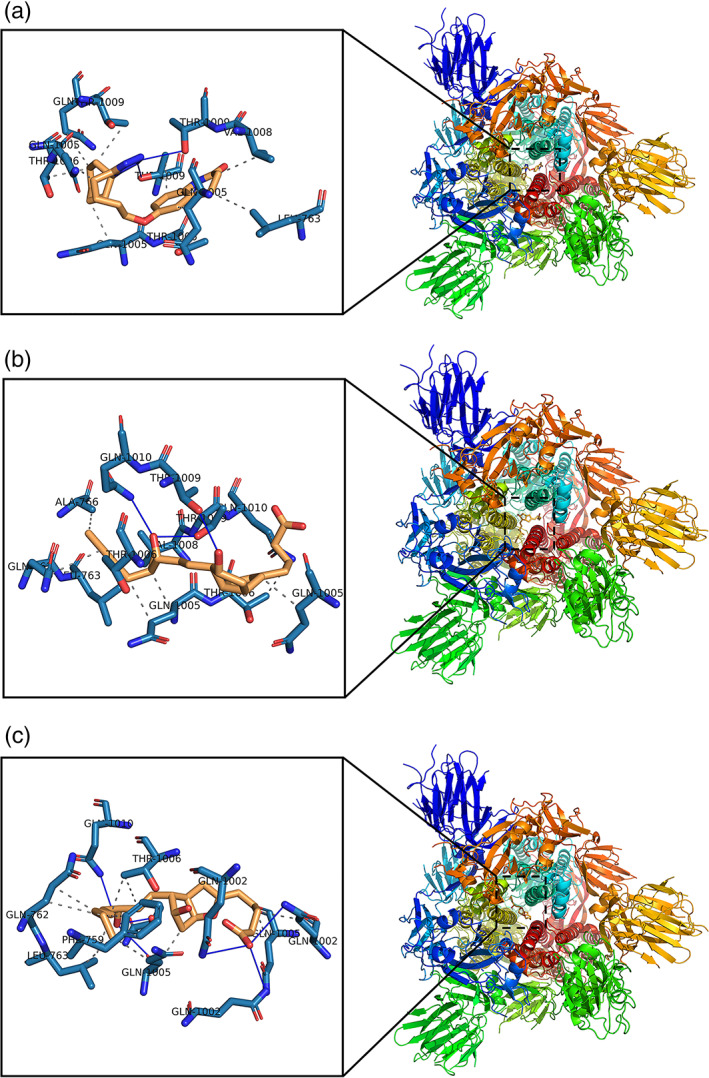
Predicted binding models obtained from the docking simulation analysis of cilostazol, iloprost, and epoprostenol against COVID‐19 Spike Glycoprotein (S). Structure of (S) protein is shown as ribbon surface model. The cilostazol, iloprost, and epoprostenol are represented as orange stick model. (a) SARS‐CoV‐2 (S)–cilostazol complex. (b) SARS‐CoV‐2 (S)–iloprost complex. (c) SARS‐CoV‐2 (S)–epoprostenol complex. The active site residues in the expanded panels are represented in blue sticks. H‐bonds and hydrophobic interactions are shown by blue lines, dashed‐gray lines, respectively