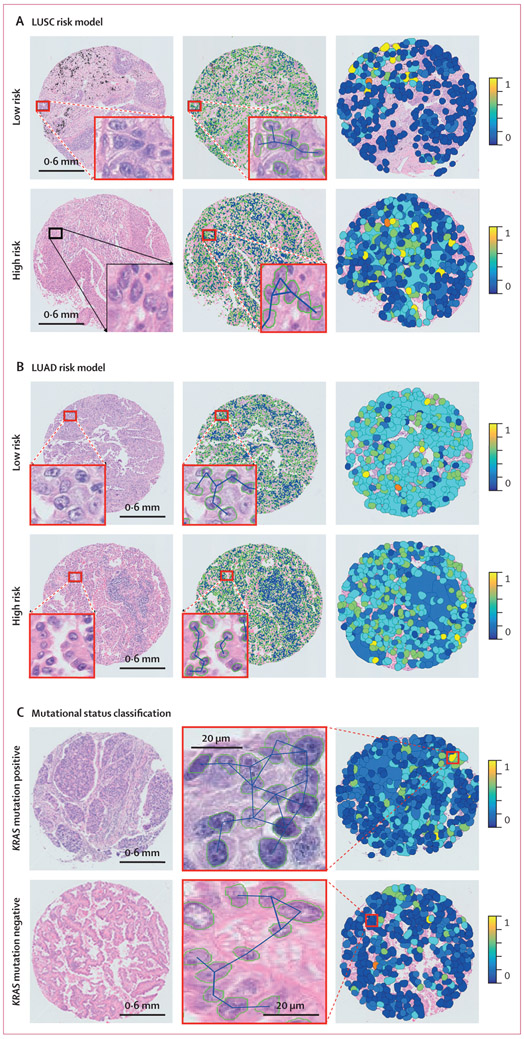
Figure 2: Cellular diversity feature maps in LUSC risk model (A), LUAD risk model (B), and mutational status classification (C).
(A) Representative cases of LUSC and CellDiv feature map illustration. (B) Representative cases of LUAD and CellDiv feature map illustration. In (A) and (B), the first column shows haematoxylin and eosin-stained images with low-risk and high-risk patients as identified by the CellDiv model. The segmented nuclei contour and connecting edges are shown in the second column. The third column shows CellDiv features that capture the CellDiv in terms of nuclear shape (ie, area in panel A and eccentricity in panel B). Each colour patch represents individual LNGs in the image, where the blue and yellow colours represent the low and high normalised feature values. (C) Representative cases of KRAS mutation positive versus KRAS mutation negative, and the corresponding CellDiv feature map. LNG=local nuclear graph. LUAD=lung adenocarcinoma. LUSC=lung squamous cell carcinoma.

