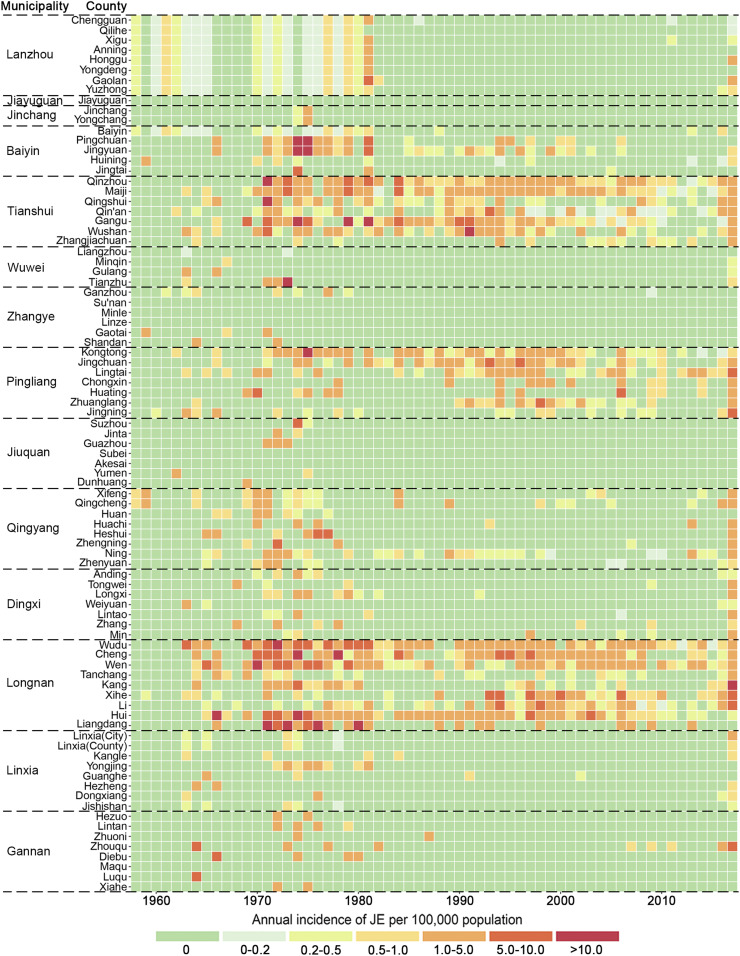
Figure 3.
Heatmap representing annual Japanese encephalitis (JE) incidence of each county in Gansu Province, China. The horizontal dimension indicates the year of JE infection, whereas the vertical size indicates the distribution of the epidemic in county of Gansu. The color of the cells represents the magnitude of the incidence of JE in that cell. This figure appears in color at www.ajtmh.org.

