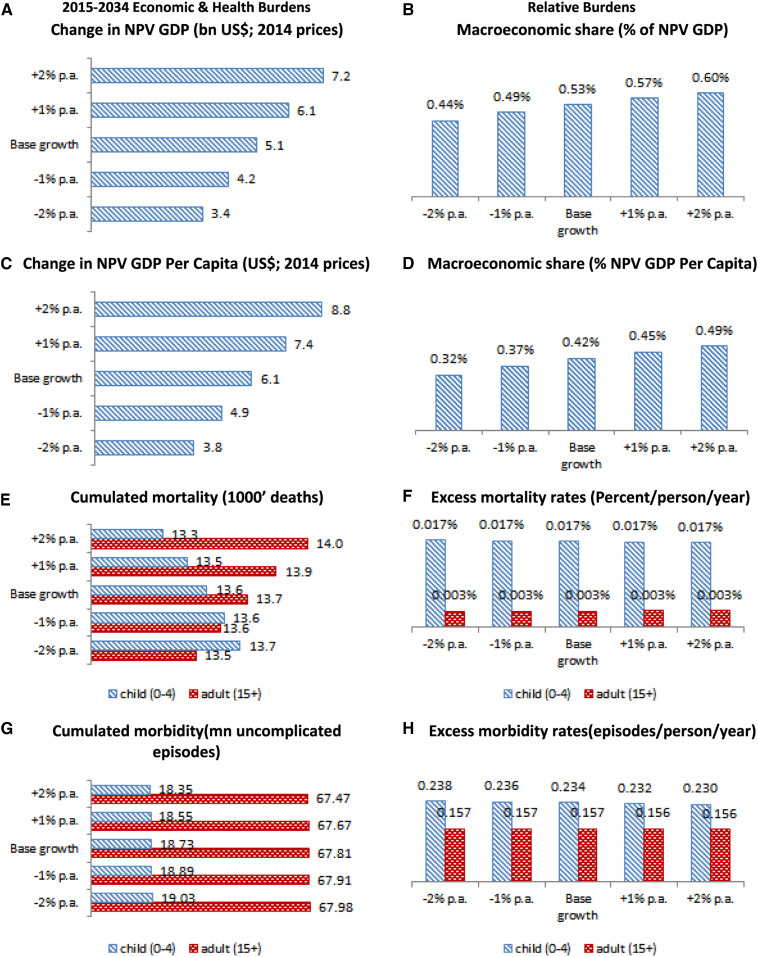
Figure 3.
2015–2034 Malaria disease burdens in Ghana: The impact of economic development. (A) Change in NPV GDP (billion US$; 2014 prices). (B) Macroeconomic share (% of NPV GDP). (C) Change in NPV GDP per capita (US$; 2014 prices). (D) Macroeconomic share (% NPV GDP per capita). (E) Cumulated mortality (1,000 deaths). (F) Excess mortality rates (percent/person/year). (G) Cumulated morbidity (million uncomplicated episodes). (H) Excess morbidity rates (episodes/person/year). Change in NPV GDP = change in net present value of GDP (accounting for the future value of money); % of NPV GDP = percentage of net present value of GDP (accounting for the future value of money); p.a. = per annum. This figure appears in color at www.ajtmh.org.

