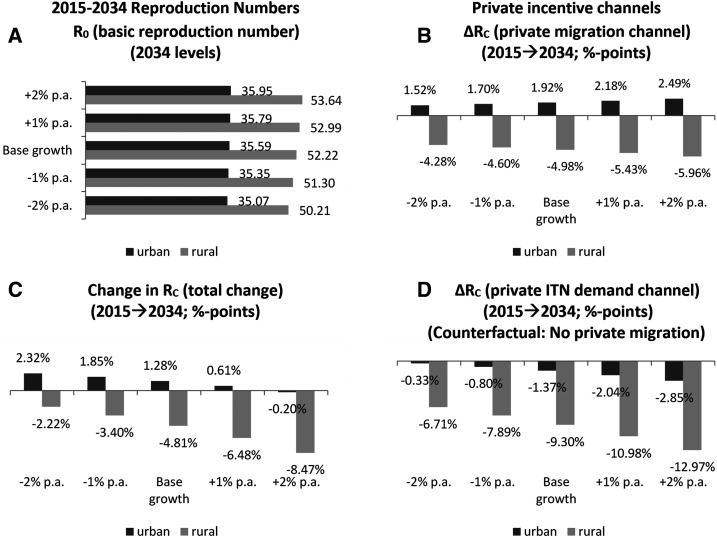
Figure 4.
2015–2034 Malaria reproduction numbers in Ghana: The impact of economic development and private incentive channels. (A) R0 (basic reproduction number) (2034 levels). (B) ∆RC (private migration channel) (2015–2034; percentage points). (C) Change in RC (total change) (2015–2034; percentage points). (D) ∆RC (private ITN demand channel) (2015–2034; percentage points) (counterfactual: no private migration). R0 = reproductive number; ∆RC = change in controlled reproductive number; p.a. = per annum.

