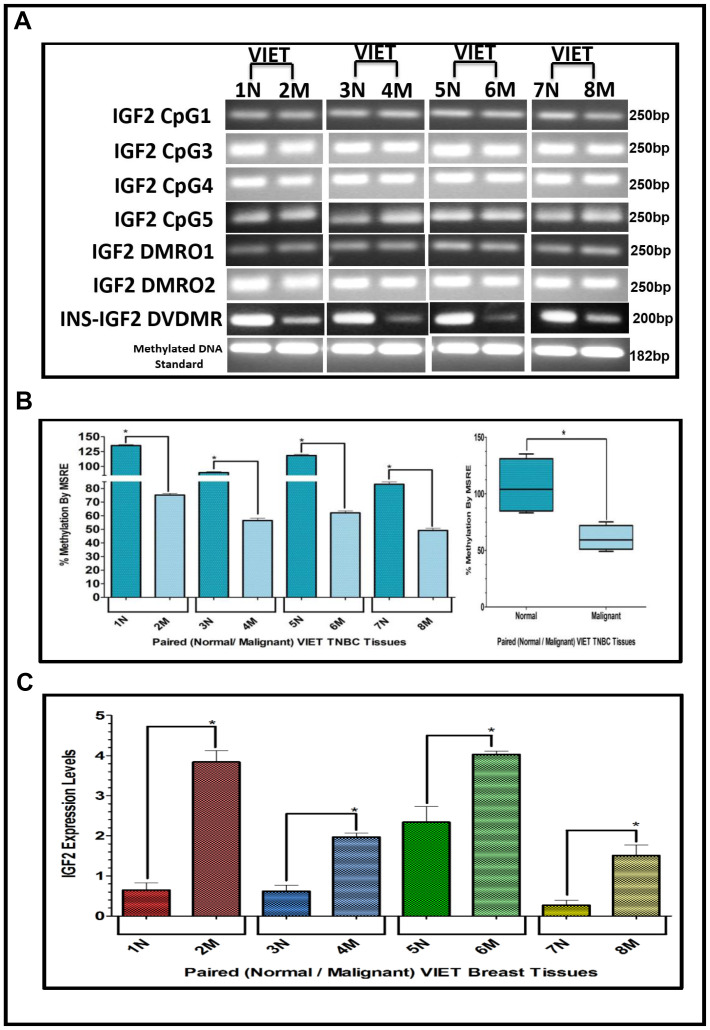
Figure 5.
(A–C) EtBr Agarose gel of IGF2 CpG islands and DMRO’s and Bar graphs of % methylation and IGF2 protein levels in paired normal/malignant breast tissues from VIET women. (A) shows an ethidium bromide stained agarose gel of bisulphite g-DNA fragments produced by PCR amplification of the CpG and DMRO regions of the IGF2 gene in paired breast cancer tissues from Vietnamese women (VIET); (B) Shows a comparative bar graph of the methylation of the INS-IGF2 DVDMR in paired tissues VIET by Methyl Sensitive Restriction Enzyme (MSRE) qPCR; Average % MSRE Methylation shown by Box and Whisker Plots. (C) Bar graph of the IGF2 levels in paired breast tissues assessed by RPPA assay. The TNBC tissue samples details are shown in Table 2. *symbol denotes paired samples (Normal/Malignant) from same patient.

