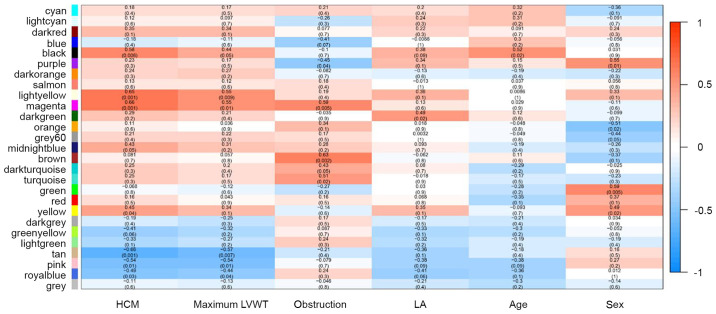
Figure 2.
Module-trait associations. Each row corresponds to a module eigengene, and each column a clinical trait. The corresponding correlation coefficient (top) and P-value (bottom) for each module-trait pair is displayed in each cell. The correlation coefficient was assigned a color according to a color scale ranging from-1 (blue) to 1 (red). HCM, hypertrophic cardiomyopathy; LVWT, left ventricular wall thickness; LA, left atrial diameter.

