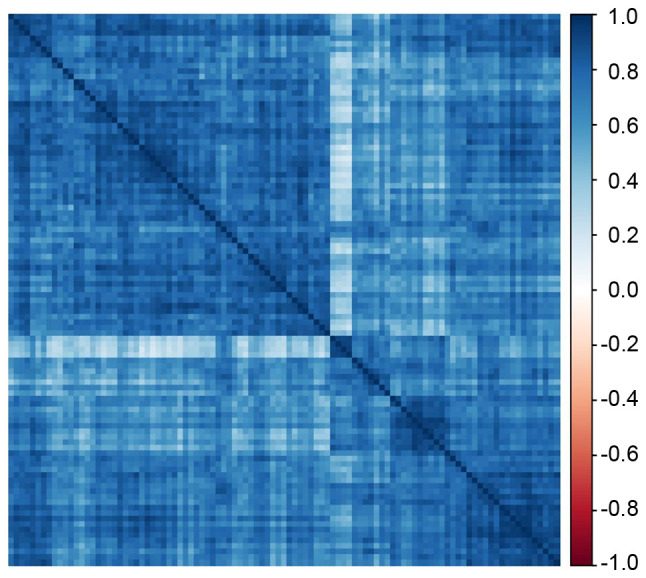
Figure 4.

Hub lncRNA correlation plot. The correlation plot illustrates the correlation matrix among hub lncRNAs in the co-expression network analysis. Each row or column corresponds to one lncRNA. The correlation coefficient for lncRNA pairs was assigned a color according to a color scale ranging from-1 (blue) to 1 (red). LncRNA, long non-coding RNA.
