
FIGURE 1 |.
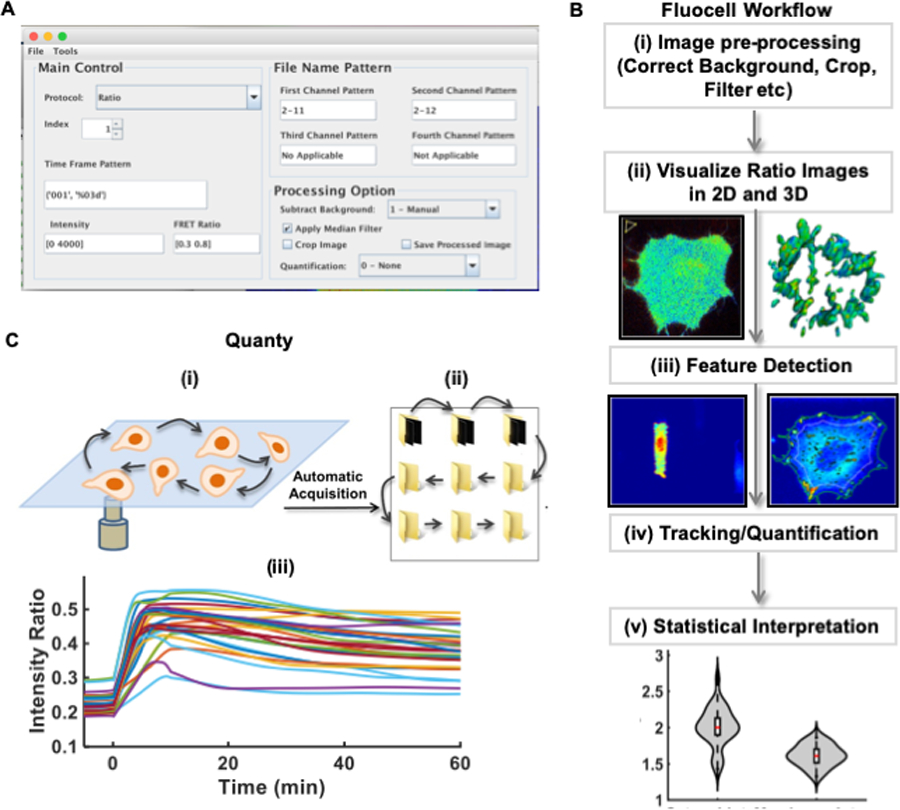
Fluocell overview and features. (A) A screenshot of the main Fluocell interface; (B) Schematic of a typical ratio image visualization and analysis pipeline of Fluocell; (C) The multiple-position quantification feature in the Quanty module: (i) The video image data of multiple cells are obtained by a microscope with an automated stage. (ii) The image files for each cell are sorted into a folder by the batch_sort_file_multiple_position function; the g2p_quantify function automatically scans the list of folders and quantifies the time courses of intensity ratio for all cells. (iii) The time courses are collected and plotted by the group_plot function to allow further analysis.