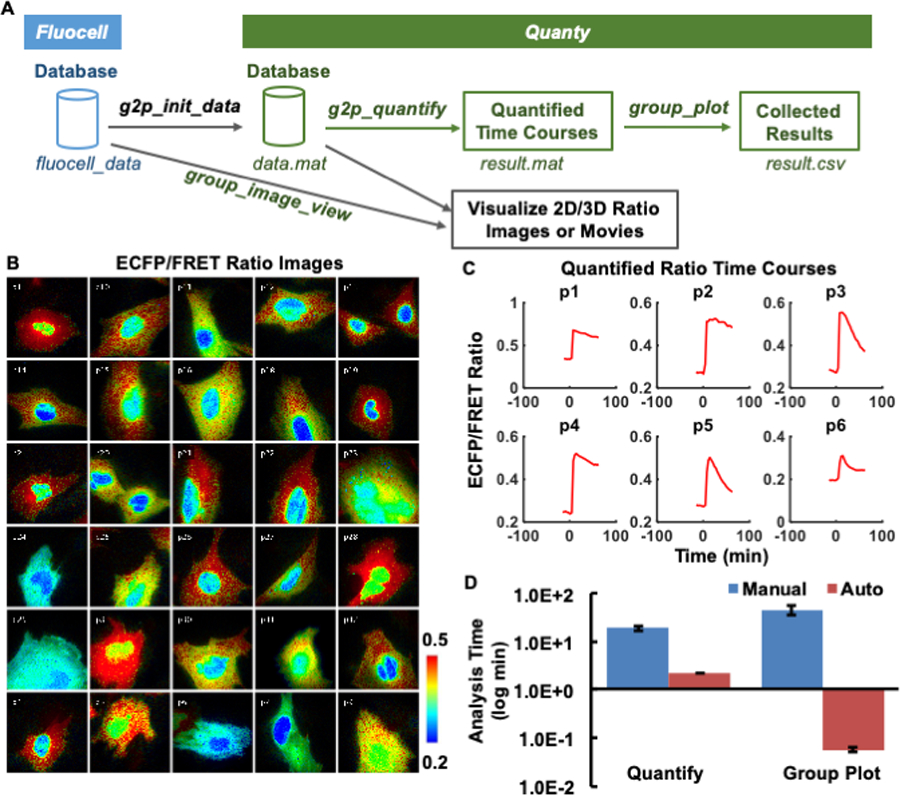
FIGURE 2 |.

Display of the group view of single-cell ratio images and quantified time courses. (A) The schematics showing the interface between Fluocell and Quanty, as well as the Quanty workflow. The quantification and visualization workflow is show in green and back colors, respectively. (B) Shows the IMD ECFP/FRET emission intensity ratio images of the cells visualized by the group_image_view function. The images are from different positions recorded during the same imaging experiments; (C) Shows the emission ratio time courses quantified by the g2p_quantify function for the first six cells in the group. (D) Compares the required image analysis time between manual analysis by three experienced researchers in MetaFluor and automatic analysis by Fluocell/Quanty (30 cells, 24 frames/cell). Left: time used to quantify the ECFP/FRET ratio time course manually or automatically by g2p_quantify; Right: time used to plot the time ECFP/FRET ratio time courses based on results from the left panel, manually or automatically by group_plot.
