Figure 1.

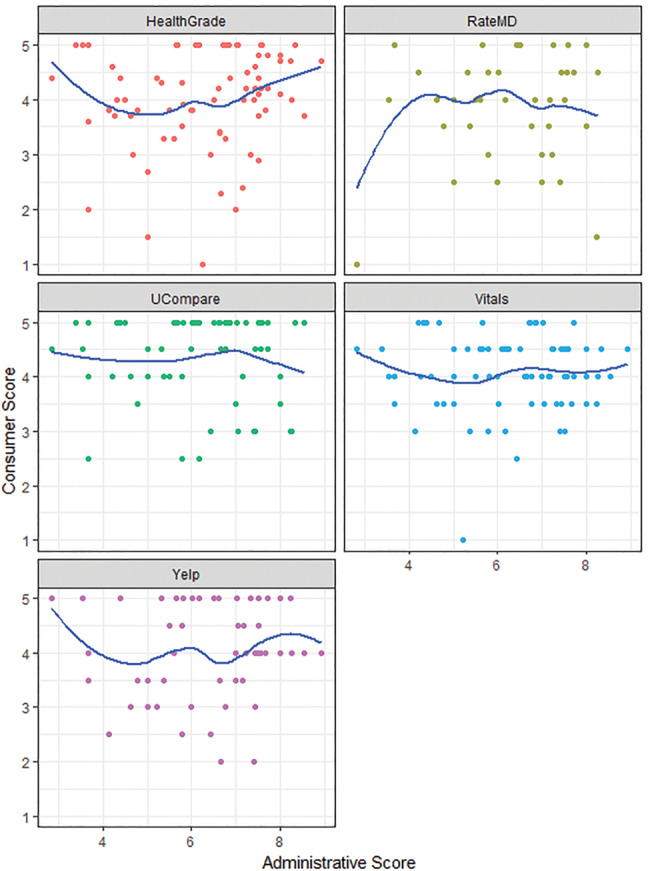
(C) Scatterplots and Lowess line smoother overlays depicting mean consumer ratings scores and mean administrator scores.

(C) Scatterplots and Lowess line smoother overlays depicting mean consumer ratings scores and mean administrator scores.