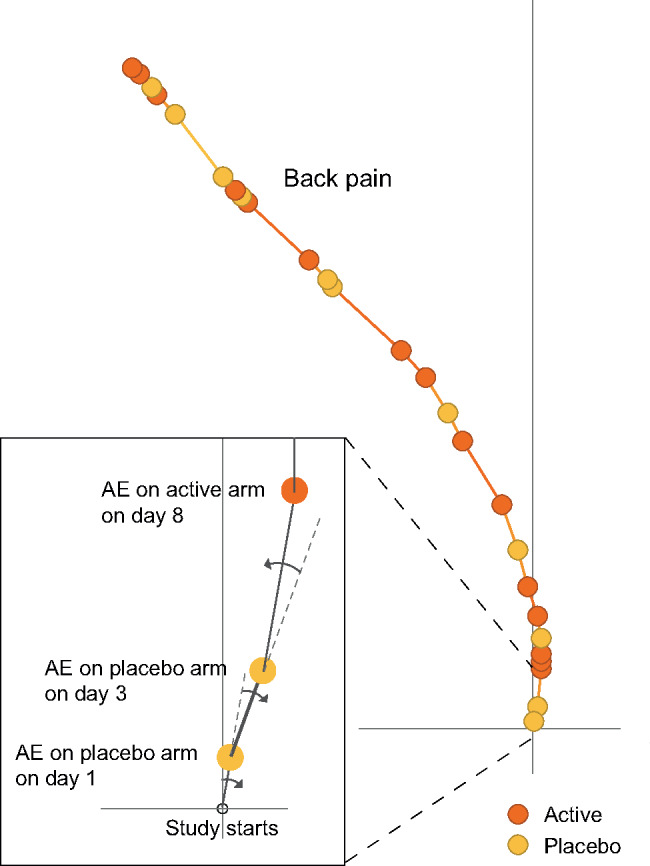
Figure 1.

The Tendril plot algorithm concept illustrated on a portion of a single preferred term: Back pain. The inset zooms in on the first 3 events to demonstrate how events on placebo tilt the tendril to the right and events on active tilt the tendril to the left. To emphasize this step in the algorithm, in this plot, the events are colored by treatment arm; yellow and brown circles for placebo and active arm, respectively. The distance between points are proportional to time between events. Point size is not linked to any information.
