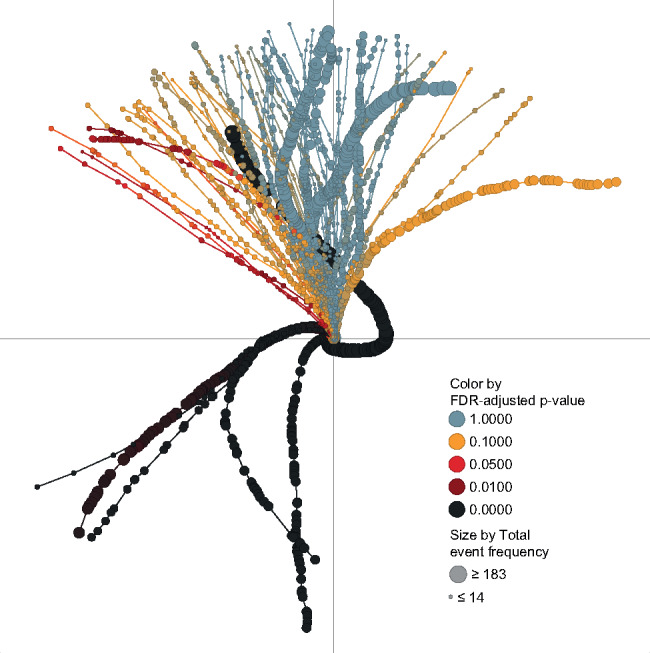
Figure 2.

A tendril plot of all AEs in the RE2SPOND trial. Each MedDRA PT is represented by a line (tendril) and each point is an event. Since time runs along each tendril, it is the shape that carries the important information, rather than the x and y coordinates. An event on the roflumilast treatment arm will tilt tendril direction to the left, and an event on the placebo arm will tilt tendril direction to the right. Point size is indicative of the total number of events for the type of AE in both treatment arms in the trial. The FDR adjusted Pearson’s chi-squared P-value in each point is mapped onto a continuous color gradient.
