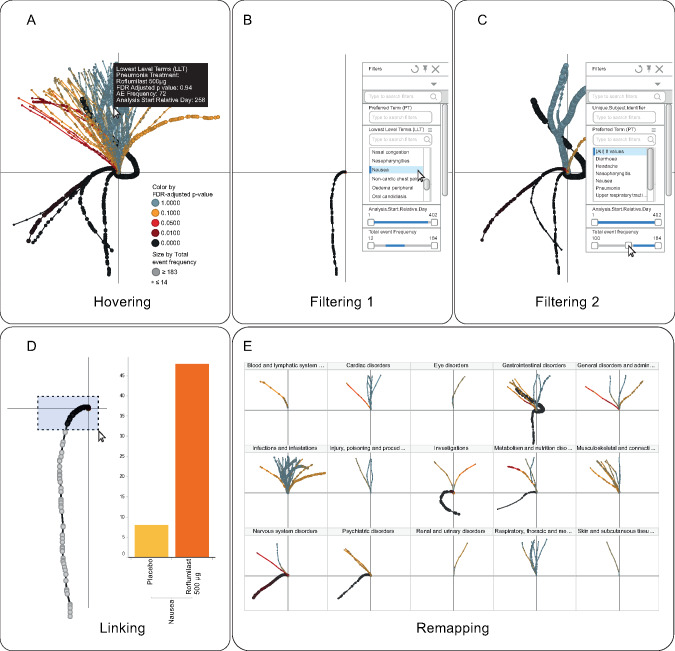
Figure 3.
Panel showing examples of interactivity. For example (A) hovering over an event gives detailed information about type of AE, AE frequency, etc.; selecting a specific PT in (B); filtering to a subset of PTs with a total event frequency ≥100 in (C); linking selected events to additional information in (D); and recasting into a trellis configuration, for assessment by SOC, in (E).

