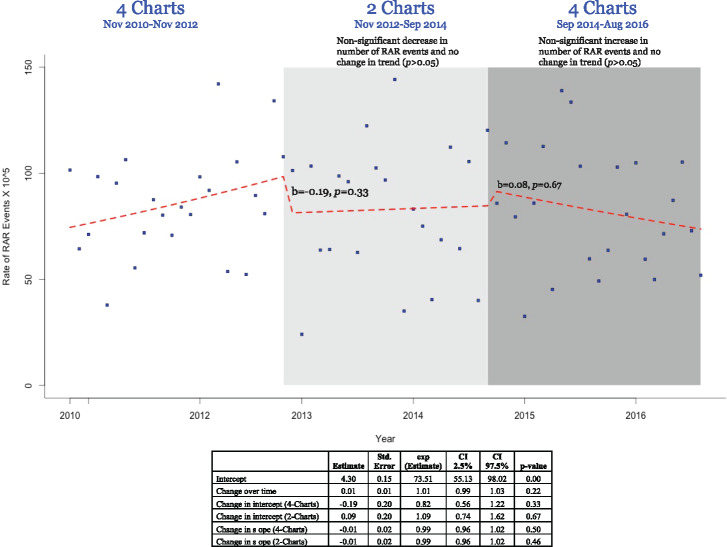
Figure 1.
The changes in number of RAR events over time. The dots represent the number of RAR events (per 100 000 orders); the dotted line shows the fitted line. The estimates of the change in intercept were: from 4 charts to 2 charts: b1 = −0.19, P = .33; from 2 charts to 4 charts: b2 = 0.08, P = .67 (marked in the figure). The changes in trend (slope) were as follows: after 4 charts to 2 charts: b3 = −0.01, P = .49; after 2 charts to 4 charts: b4 = −0.01, P = .46. The regression estimates are also provided.

