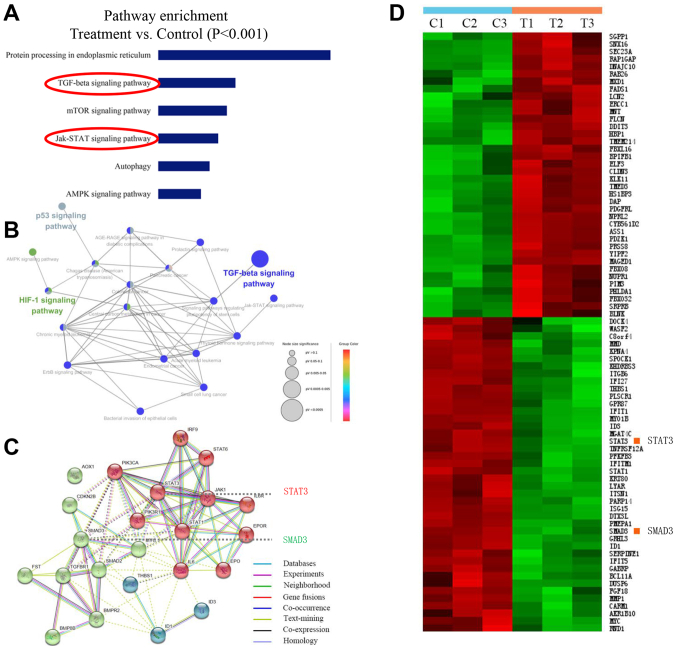
Figure 3.
Differential gene profiling in narasin-treated vs. control BC cells by RNA microarray. (A) KEGG pathway analysis by functional enrichment in the PPI network (P<0.001). In the case of a large number of samples, the difference ratio is not the only way to determine whether a gene is differentially expressed, other statistical parameters can also be combined (such as P-value and Q-value), so FDR<0.05 and P<0.001 were both used to reduce false positive rate. (B) KEGG pathway interaction network. (C) KEGG pathways and the PPI network. (D) Hierarchical clustering heat map of KEGG pathways in untreated group (C1-C3) and treated group (T1-T3) in BC cells. BC, breast cancer; KEGG, Kyoto Encyclopedia of Genes and Genomes; PPI, protein-protein interaction.

