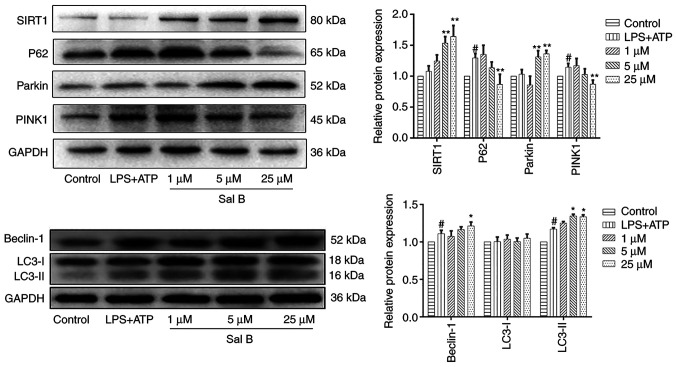
Figure 5.
Sal B treatment significantly promotes mitophagy in H9C2 cells. Western blot analysis was performed to determine the protein expression levels of SIRT1, P62, Parkin, PINK1, Beclin-1 and LC3 in each group. The protein expression levels were normalized to those of GAPDH. Data are presented as the mean ± standard deviation from three independent experiments. #P<0.05 vs. the control group; *P<0.05, **P<0.01 vs. the LPS + ATP group. ATP, adenosine triphosphate; LC3, microtubule-associated protein 1A/1B-light chain 3; LPS, lipopolysaccharide; PINK1, PTEN-induced kinase 1; Sal B, salvianolic acid B; SIRT1, sirtuin 1.

