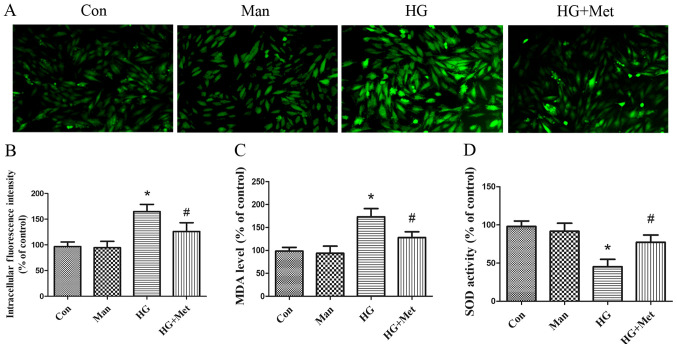
Figure 2.
Effects of metformin (1 mM) on high glucose-induced oxidative stress in H9C2 cells. Cells were divided into four groups: i) Con, normal medium; ii) Man, 33.3 mM Man; iii) HG, 33.3 mM glucose; and iv) HG + Met, 33.3 mM glucose pretreated with 1 mM Met. ROS levels were detected by (A) dichlorofluorescein fluorescence intensity and (B) quantified. Magnification, ×200, Scale bars=50 µm. (C) MDA and (D) SOD levels. *P<0.05 vs. Con; #P<0.05 vs. HG. Man, mannitol; HG, high glucose; Met, metformin; ROS, reactive oxygen species; MDA, malondialdehyde; SOD, superoxide dismutase; Con, control.

