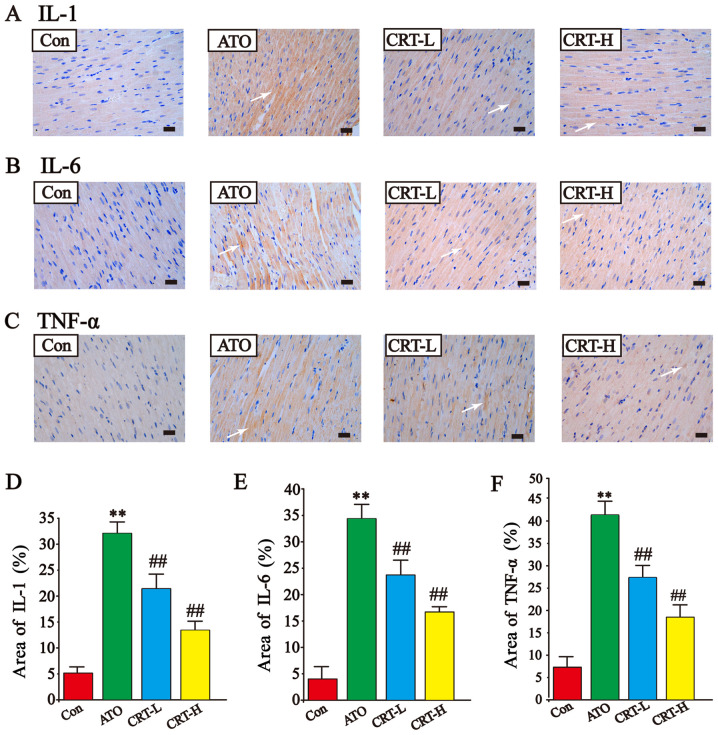
Figure 7.
Effects of CRT on the expression levels of IL-1, IL-6 and TNF-α in ATO-treated rats detected via immunohistochemistry. Anatomical location of (A) IL-1 expression, (B) IL-6 expression and (C) TNF-α expression. Immunoreactive IL-1, IL-6 and TNF-α areas are indicated by white arrows. Quantification of the % area of (D) IL-1 expression, (E) IL-6 expression and (F) TNF-α expression. Scale bar, 50 µm; magnification, ×400. Data are presented as the mean ± SEM for each group, n=10. **P<0.01 vs. Con group; ##P<0.01 vs. ATO group. CRT, crocetin; Con, control; ATO, arsenic trioxide; CRT-L, ATO + low concentration of CRT treatment group; CRT-H, ATO + high concentration of CRT treatment group.

