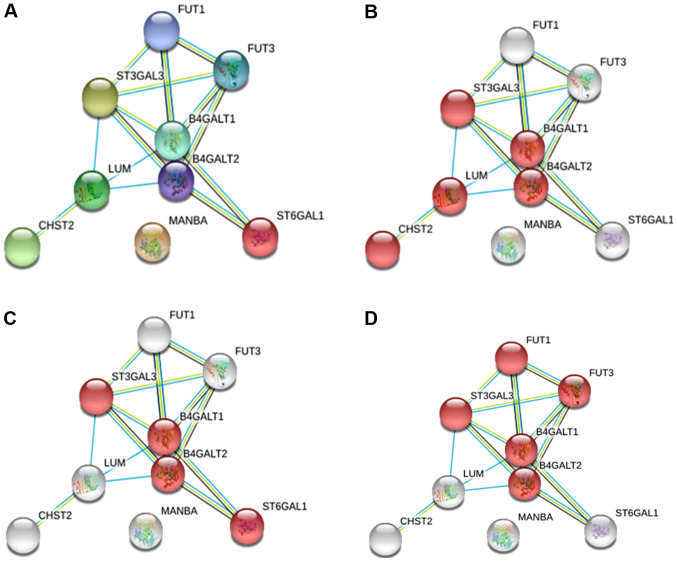
Figure 3.
Protein-protein interaction network of the upregulated glycogenes. (A) Network of upregulated glycogenes with five additional proteins that interacted with the altered glycogenes. (B) The red network indicates proteins that participate in the keratan sulfate biosynthetic process. (C) The red network indicates the proteins that participate in N-glycosylation. (D) The red network indicates the proteins that participate in glycosphingolipid biosynthesis.

