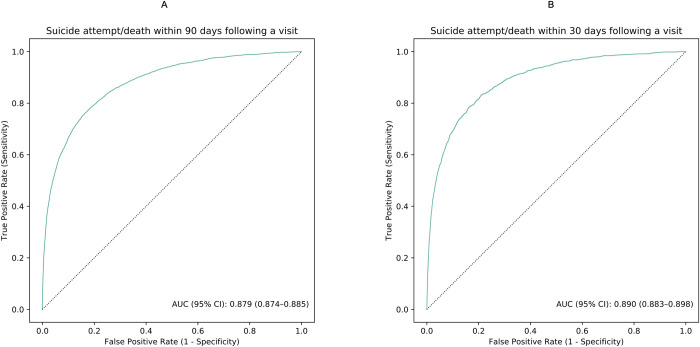
Fig 1.
ROC curves illustrating model discrimination accuracy in the test set for predicting suicide attempt/death within 90 (A) and 30 days (B) following a visit to psychiatric specialty care during 2011 and 2012. The figure was based on the discrimination accuracy of the ensemble models. The solid line in brown represents the ROC curves achieved by the models. The dotted line in black represents the ROC curves when AUC equals 50%. AUC, area under the receiver operating characteristic curves; ROC, receiver operating characteristic.

