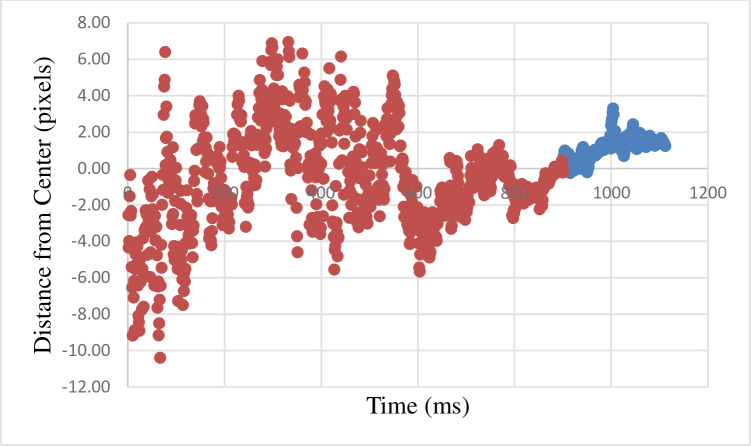
Fig 9. The graph describes, for each time point, the mean distance of the gaze from the center of the screen (which is also the final point of masked probe).
Each point is the average across all participants and all trials. Red marks the average gaze during the masked probe presentation. Blue marks the average gaze during the delay period–between the offset of the masked probe and the onset of the conscious target. 1-pixel equals 0.024-degree in the visual field.

