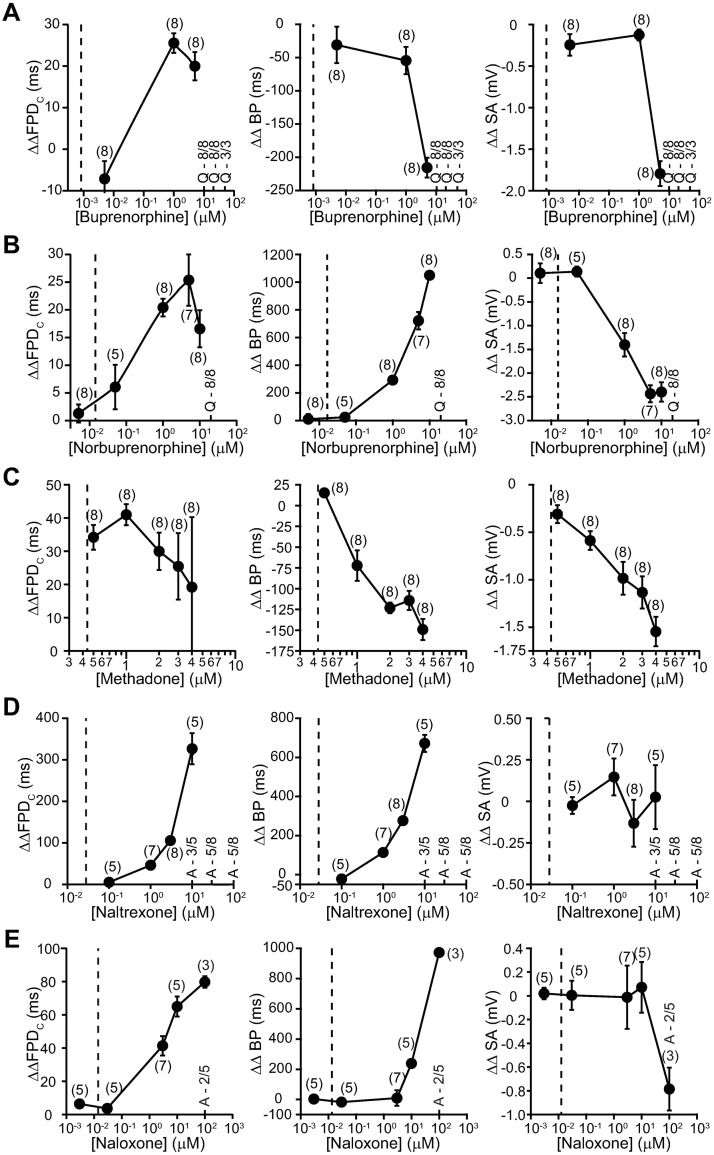
Fig 8. Field recordings of iPSC-CMs.
Concentration-dependent changes in ΔΔFPDC, ΔΔBP, and ΔΔSA of iPSC-CMs treated with various concentrations of buprenorphine (A), norbuprenorphine (B), methadone (C), naltrexone (D), and naloxone (E) on MEA plates. The effect of opioids was analyzed 30 minutes after adding respective drugs to the wells. ‘Quiescence’ was observed in few instances at higher drug concentrations. These events are denoted as “Q” in panels along with the number of replicate wells that showed ‘quiescence’. Arrythmia-like events were also observed in iPSC-CMs when treated with naltrexone at 10, 30 and 100 μM and naloxone at 100 μM. These events are denoted as “A” in panels along with the number of replicates. Data are represented as mean ± SEM. The vertical dashed line indicates free Cmax for buprenorphine, methadone, naltrexone, and naloxone, and total Cmax for norbuprenorphine.

