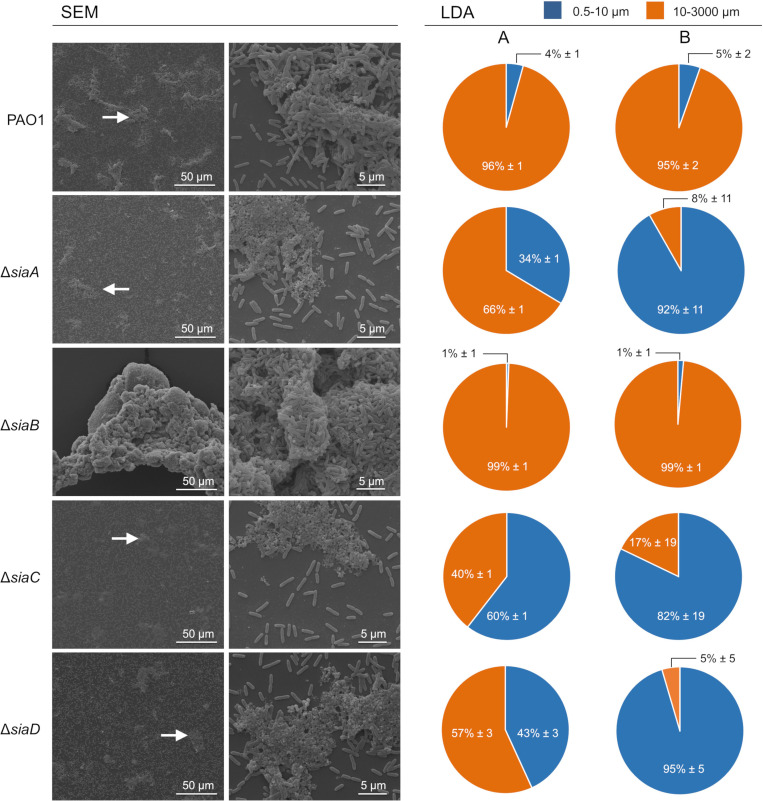
Fig 2. Scanning electron microscopy (SEM) and laser diffraction analysis (LDA) demonstrated the different aggregation phenotypes of P. aeruginosa wildtype and mutant strains during growth with glucose.
Triplicate cultures of strains were grown with 22 mM glucose in 50 mL cultures shaking at 200 rpm at 30°C. After 5.5 h incubation, the replicate samples were pooled and used for SEM. The white arrows (left panel) highlight representative regions showing aggregated cells, which were then examined at higher magnification (right panel). Similar samples were also analyzed using a particle size analyzer (SALD 3101, Shimadzu; see Materials and Methods for details) in the range 0.5–3000 μm diameter. The data obtained from two independent biological replicates (A and B; n = 2) are presented as the percentages of the total bio-volume of particles distributed over two different size ranges (0.5–10 μm and 10–3000 μm) relative to the total bio-volume of all particles detected. The data represent the mean value of triplicate measurement of the same sample (n = 3) with the corresponding technical error.

