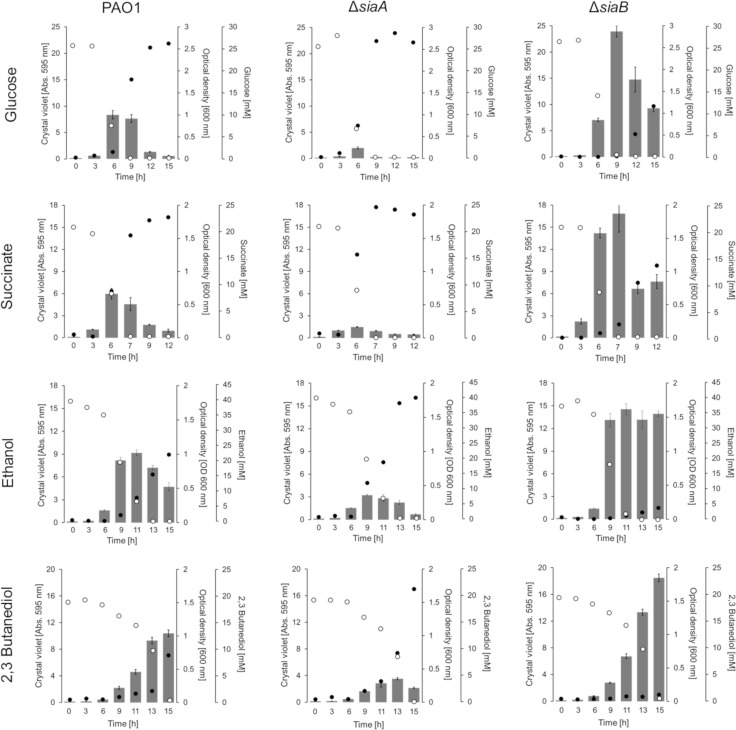
Fig 3. Quantification of biofilm formation and growth in suspension of strains PAO1, ΔsiaA and ΔsiaB with 22 mM glucose, 20 mM succinate, 40 mM ethanol or 20 mM 2,3-butanediol in 24 well microtiter plates (growth of the ΔsiaC and ΔsiaD mutants are shown in S1 Fig).
Individual 24 well microtiter plates were used to quantify attached biofilms by crystal violet (CV) staining (grey bars) as well as the growth in the supernatant as OD600 (black dots); substrate concentrations are shown (open circles). For crystal violet (CV) staining, the data are shown as the mean value of four biological replicates (n = 4). To reduce complexity, the standard deviation of replicates is shown as error bars. OD600 and substrate concentrations represent the mean value from the same quadruplicates but quantified from pooled (1:1:1:1 [v/v/v/v]) samples using a photometer, the GO assay kit and specific HPLC methods, respectively (see Materials and Methods for details). All cultures were incubated at 30°C and 200 rpm shaking.

