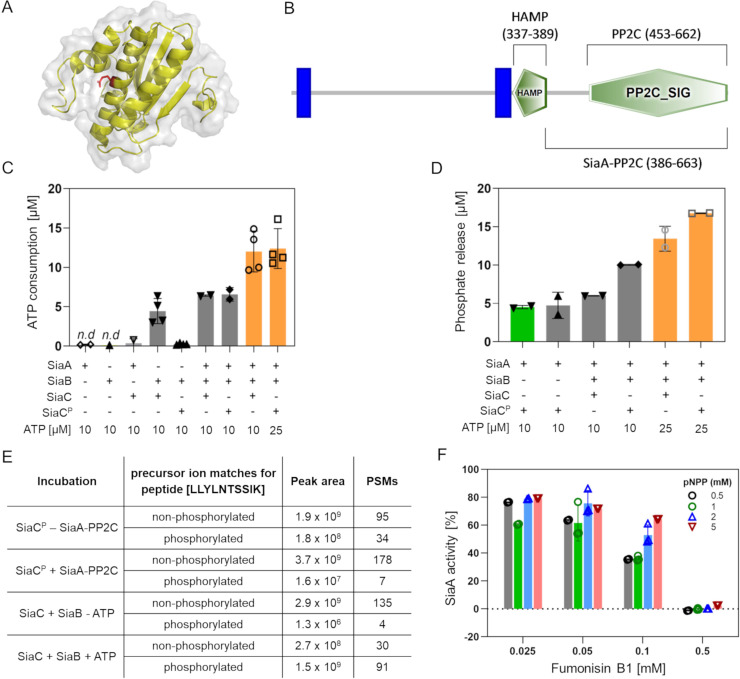
Fig 4.
(A) Homology model of SiaB (PA0171) predicted using I-Tasser (https://zhanglab.ccmb.med.umich.edu/I-TASSER/) shown as cartoon with 80% transparent surface using the Pymol software (version 2.1.1). The predicted catalytic glutamic acid residue at position 61 is highlighted (red sticks). (B) Representation of SiaA using the SMART online tool (http://smart.embl-heidelberg.de/). The predicted PP2C_SIG domain, the HAMP domain and the two membrane-spanning regions (blue bars) are represented. (C) ATP consumption of SiaB measured by the ADP-Glo™ assay kit. Assays were performed for 1 h at 37°C in 20 mM Tris-HCL [pH 7.5], 150 mM NaCl in the absence or the presence of 10 mM ATP. (D) Phosphate quantification using a malachite green assay after incubation. Reactions were performed for 1 h at 37°C with 0.5 μM SiaA or SiaB and 5 μM of SiaC or SiaCP in 20 mM Tris-HCL [pH 7.5], 150 mM NaCl buffer containing 20 mM MgCl2 or MnCl2 (green bar), and 10 or 25 μM ATP (orange bars). (E) Summary of shotgun peptide-mass spectrometry (PMS) results from analysis of SiaC purified from E. coli and the ΔsiaA mutant after incubation with SiaB and SiaA-PP2C, respectively. Incubations were performed for 2 h at 30°C prior to separation by SDS-PAGE for PMS (see Materials and Methods) (F) Phosphatase activity of SiaA-PP2C in the presence of 0.5–5 mM of pNPP and 0–0.5 mM of fumonisin B1. Assays were performed in 150 mM NaCl, 20 mM Tris-HCl pH 7.5 at 37°C and measured as an increase in absorbance [405 nm]. The initial rate of reaction was calculated and expressed as a percentage compared to the untreated control. Data in C, D and F are presented as the average from at least two independent enzymatic assays (bars; n = 2–4) with the corresponding standard deviation of the mean (error bars) and the individual data points (circles). Results below the detection limit are indicated (n.d.).

