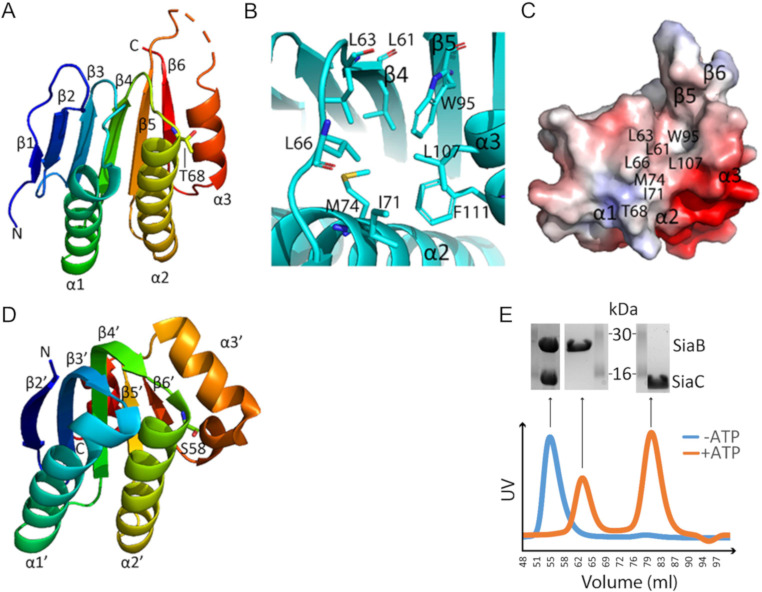
Fig 6.
(A) “Rainbow” representation of SiaC (PDB ID: 6K4F). The phosphorylation site T68 is shown as sticks. (B) Hydrophobic pocket of SiaC next to T68. (C) Surface electrostatic potential of SiaC with the hydrophobic pocket labelled. The structure is displayed in the same orientation as in panel B. (D) “Rainbow” representation of 4QTP. The phosphorylation site S58 is shown as sticks. (E) Size-exclusion chromatography profiles derived by UV-Absorption for SiaB/SiaC mixtures (1:1 molar ratio) in the presence (orange line) or absence (blue line) of 10 mM ATP and 20 mM MgCl2. The SDS-PAGE analysis of the proteins causing the peaks in the size exclusion chromatography are shown above the profiles.

