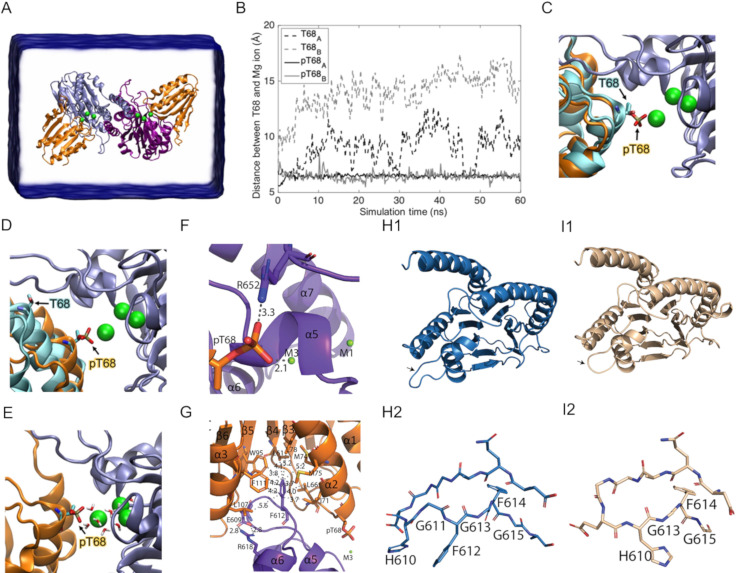
Fig 7. Binding of SiaA-PP2C to phosphorylated SiaC.
(A) The simulated system using ZDOCK contains a SiaA-PP2C dimer (blue/purple ribbon) with SiaC (cyan ribbon) or SiaCP (orange ribbon) docked to each SiaA-PP2C monomer. (B) Distance between Cα of T68/pT68 and Mg2+ ion (M3). Phosphorylated T68 of both SiaCP (black and grey solid lines) remains coordinated with the Mg2+ ion (green sphere). Unphosphorylated T68 (black and grey dashed lines) dissociates from the Mg2+ ion in < 15 ns. The positions of T68 and Mg2+ ions before (C) and after the simulation (D) are displayed in the same color code as in panel A. (E) The pT68 of SiaCP is interacting with the bridging water molecules for the entire 60 ns of simulation. (F-G) Cartoon representations of specific parts of the SiaA-PP2C/SiaCP complex after 60 ns of simulation (S2 File). SiaCP is coloured in orange; SiaA-PP2C dimer is coloured in purple and blue (F) Interaction of pT68 with R652 and M3. R652 might be important for stabilisation of the complex through the formation of a salt bridge. pT68 remains in close proximity with M3 (2.1 Å). (G) F612 interacts with the hydrophobic pocket of SiaCP. Salt bridge formation between R618 and E609 in SiaA-PP2C might restrain the orientation of the flexible loop between α5 and α6 to accommodate its interaction with the hydrophobic pocket of SiaCP. Cartoon representation of SiaA-PP2C (H1) and a homology model of the mutant allele SiaA-PP2C* (I1) from the ΔsiaA mutant (S2 File), in which G611 and F612 at the flexible loop between α5 and α6 are deleted (black arrows). Stick representation of the flexible loop of SiaA-PP2C (H2) and SiaA-PP2C* (I2).

