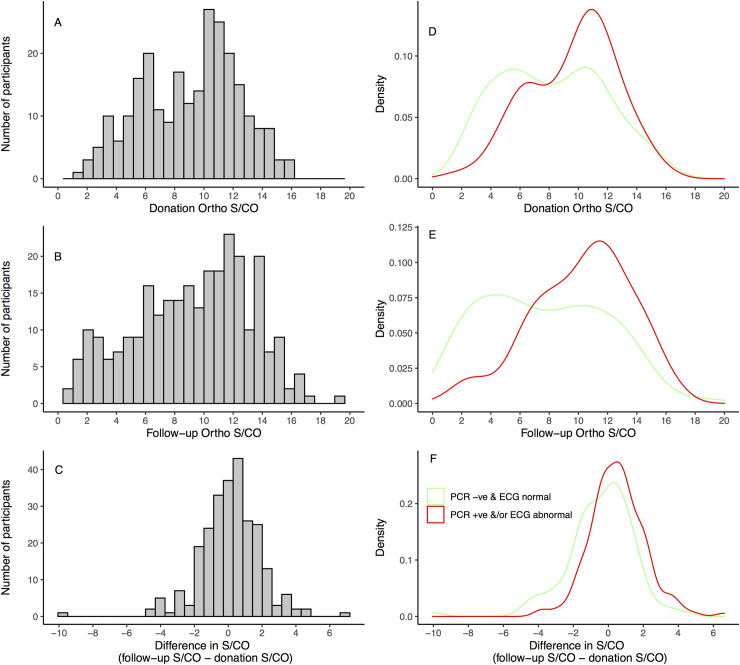
Fig 1.
Histograms of the VITROS Anti-T. cruzi signal-to-cutoff (S/CO) values among participating blood donors at donation (A) and follow-up (B), and the distribution of the difference in S/CO between the two time points (C). Smoothed kernel density plots of the distributions of donation (D), follow-up (E) and the change in S/CO (F) stratified according to PCR and ECG result (PCR -ve & ECG normal versus PCR+ve &/or ECG abnormal). In panel D, the median [IQR] S/CO in the PCR +ve &/or ECG abnormal donors is 10.2 [7.2 to 11.7], and among PCR-ve & ECG normal donors is 8.2 [5.3 to 10.9], p = 0.001 (Wilcoxon rank sum). In Panel E, comparing the same groups, the median [IQR] values are 10.6 [7.9 to 12.6] versus 7.0 [4.2 to 11.1], respectively, p <0.001 (Wilcoxon rank sum). In panel F, the median [IQR] values are respectively 0.46 [-0.4 to 1.4] and -0.2 [-1.4 to 0.76], p<0.001 (Wilcoxon rank sum).

