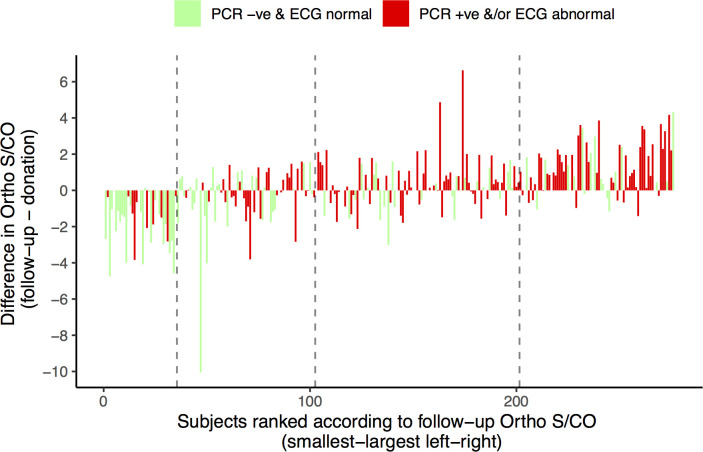
Fig 2. Waterfall plot of the change in S/CO between donation and follow-up visits for 253 subjects with results available for both time points.
Subjects with negative PCR and an ECG free of major alterations (PCR -ve & ECG normal) are represented with green bars, whereas subjects with a positive PCR and/or ECG with a major alterations (PCR +ve &/or ECG abnormal) are shown in red. Subjects are ranked (horizontal axis) according to the final VITROS Anti-T. cruzi ELISA S/CO, such that subjects with the lowest S/CO values at follow-up are shown on the far left, and those with the highest follow-up S/CO values are shown on the far right. Vertical dashed lines mark the rank positions corresponding to S/CO values of 4, 8 and 12 (left to right)–e.g. subjects to the left of the first dashed in had follow-up S/CO values < 4.

