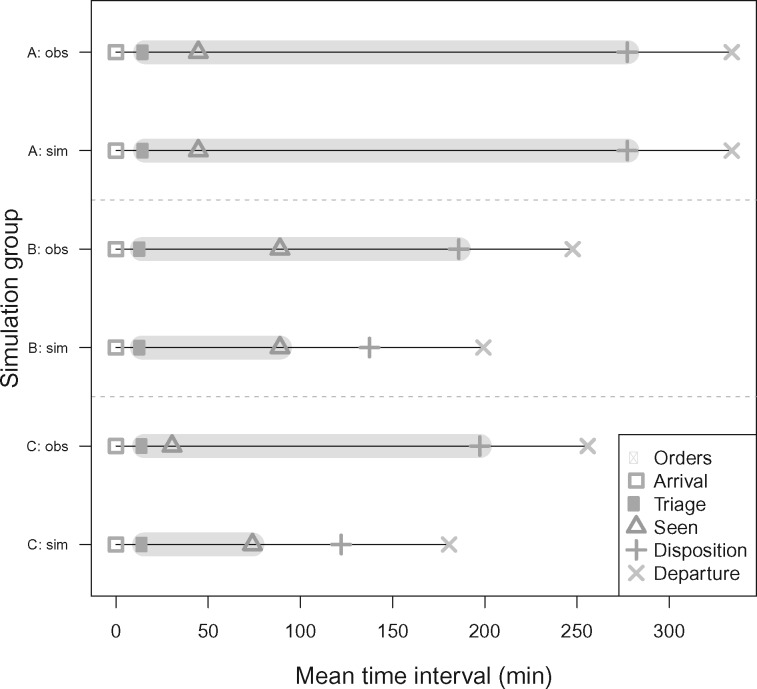
Figure 4.
Summary of simulation procedure results for assessing the effect of the prediction algorithm on reducing length of stay on each simulation group. Mean time interval estimates are shown for each group along with a time range in which orders are placed and run (gray shading) for both the original observed (obs) visit time intervals and the simulated (sim) visit time intervals. Group definitions are as follows: (A) if all orders are not correctly predicted, length of stay remains the same; (B) when all orders are correctly predicted at triage and the time between triage and time seen exceeds the amount of time for maximum order runtime, the time between when the patient is first seen and when the disposition is sampled from an exponential distribution; and (C) when all orders are correctly predicted at triage and the time between triage and time seen is less than the maximum order runtime, we extend the time between triage and first seen and sample the time between when the patient is first seen and the disposition from an exponential distribution.

