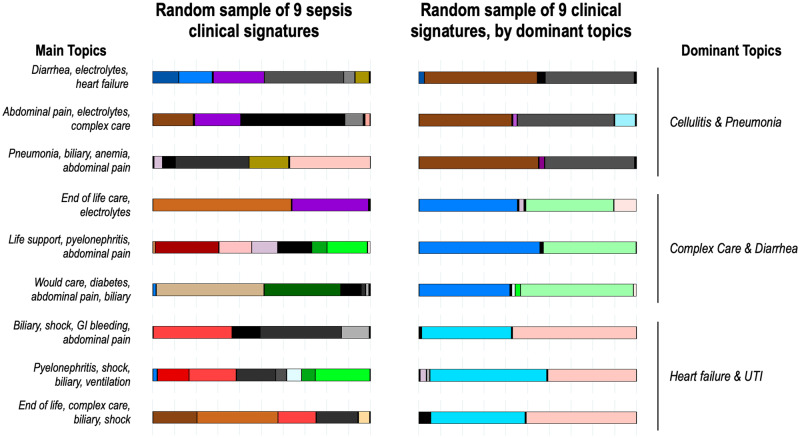
Figure 3.
Computable clinical signatures of individual patients based on the LDA topic modeling approach. Each bar color represents a different topic as displayed in Figure 2 and the width of the color bar represents the proportion of the clinical signature that topic composes. On the left are 9 randomly selected sepsis patients, including 3 each from sepsis (top), severe sepsis (middle), and septic shock (bottom) severity strata. On the right are 9 sepsis patients randomly chosen but based on 3 specific pairings of treatment topics (overall clinical signature comprised of at least 0.33 from both cellulitis and pneumonia; complex care and diarrhea; and heart failure and urinary tract infection).

