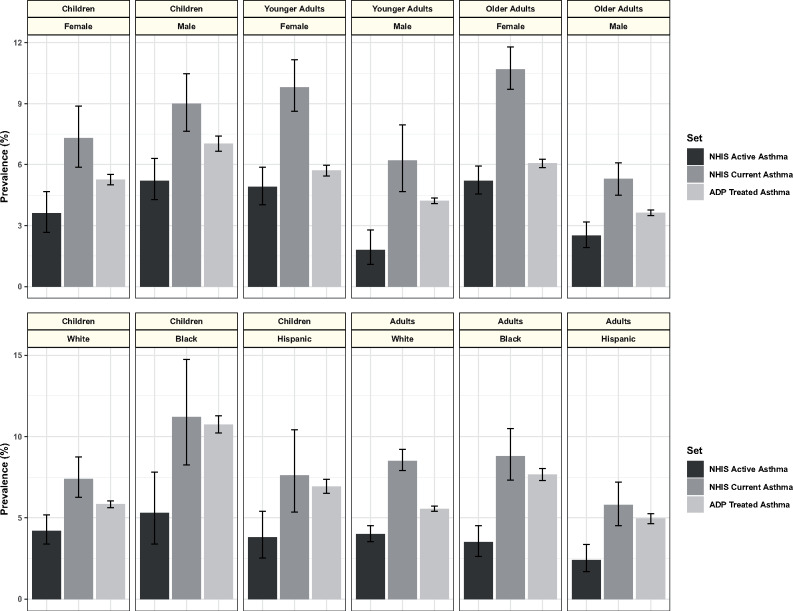
Figure 5.
Treated, current, and active asthma prevalence by age, sex, race, and ethnicity. Treated asthma prevalence is the mean of monthly values from the Aggregate Data Program (ADP) for December 2016 to November 2017, with error bars representing the standard deviation of the monthly values. Current asthma prevalence and active asthma prevalence are the National Health Interview Survey (NHIS) Early Release January to June 2017 estimates, with error bars showing the 95% confidence interval of the estimates. In the top panel, treated asthma prevalence is stratified by age, in which “children” are subjects that are <18 years of age, “younger adults” are 20-39 years of age and “older adults” are >39 years of age, while NHIS estimates are stratified as “children” for individuals under 15 of age, “younger adults” for 15-34 years of age, and “older adults” for those over 34 years of age. In the lower panel, treated asthma prevalence is stratified by age, including “children” when age is <18 years and “adults” when older, while NHIS estimates for “children” are defined as those >15 years of age and “adults” as those >15 years of age.

