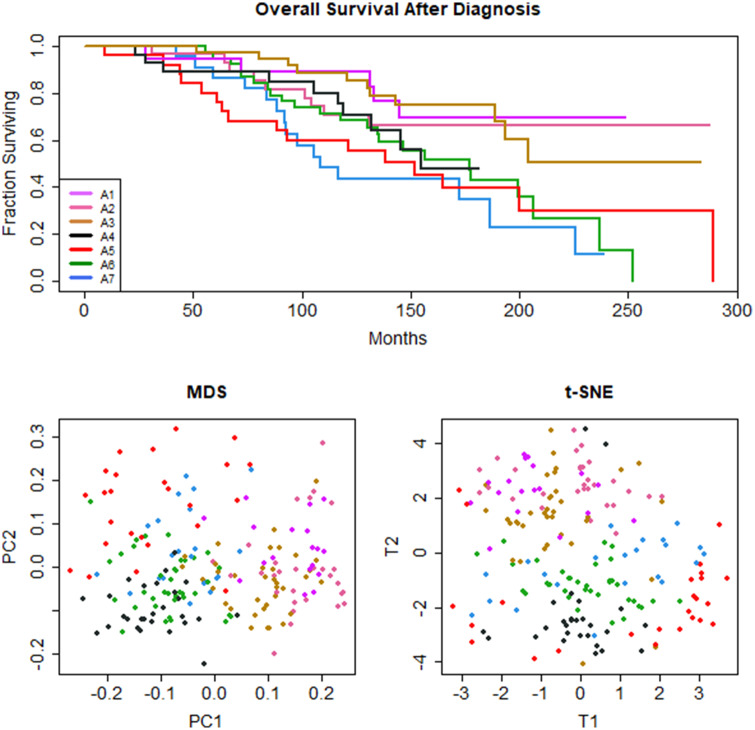
Figure 1.
Data transformation A: (A) Kaplan-Meier survival curve, (B) MDS plot, and (C) t-SNE plot for 7 unsupervised clusters of CLL patients. Unsupervised machine learning, using k-means clustering with Partitioning Around Medoids (PAM) and the Sokal&Michener distance yields 7 clinical phenotypes with significant differences in overall survival (OS) (P = .0164). Clusters separated by MDS along the first dimension reflect OS outcomes.

