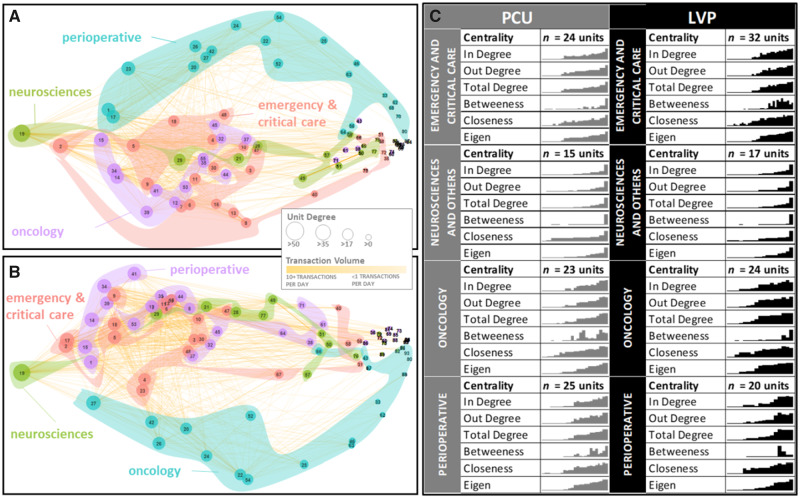
Figure 2.
Infusion pump sharing network in The Johns Hopkins Hospital. (A) The movement of PC unit (PCU)–type infusion pumps and (B) the movement of large-volume pump (LVP)–type infusion pumps. Each node represents a hospital unit (node number legend is presented in the Hospital Unit Name Glossary section of the Supplementary Appendix). The size of the nodes and the thickness of the ties are proportional to the volume of pump movement. The interior color of the nodes indicates cluster assignation based on eigencentrality. To measure if cluster assignation was statistically significant, we used the bootstrapping-based procedure presented in Fortunato and Hric20 to compare the observed clustering against random clustering in 1000 networks of same topology. All P values were <.001, and therefore we conclude that clustering presented in panels A and B are larger than expected by chance alone. (C) The network centrality distribution in each cluster. Analysis of standard deviation revealed that network centrality in the neurosciences cluster was much less variable than in the other clusters (P = .0436 and .0459 for neurosciences vs oncology and neurosciences vs perioperative, respectively; Flinger-Killen test of homogeneity of variances). No statistically significant differences in medians were detected (all P values >.05 in Kruskal-Wallis test of differences of medians).

