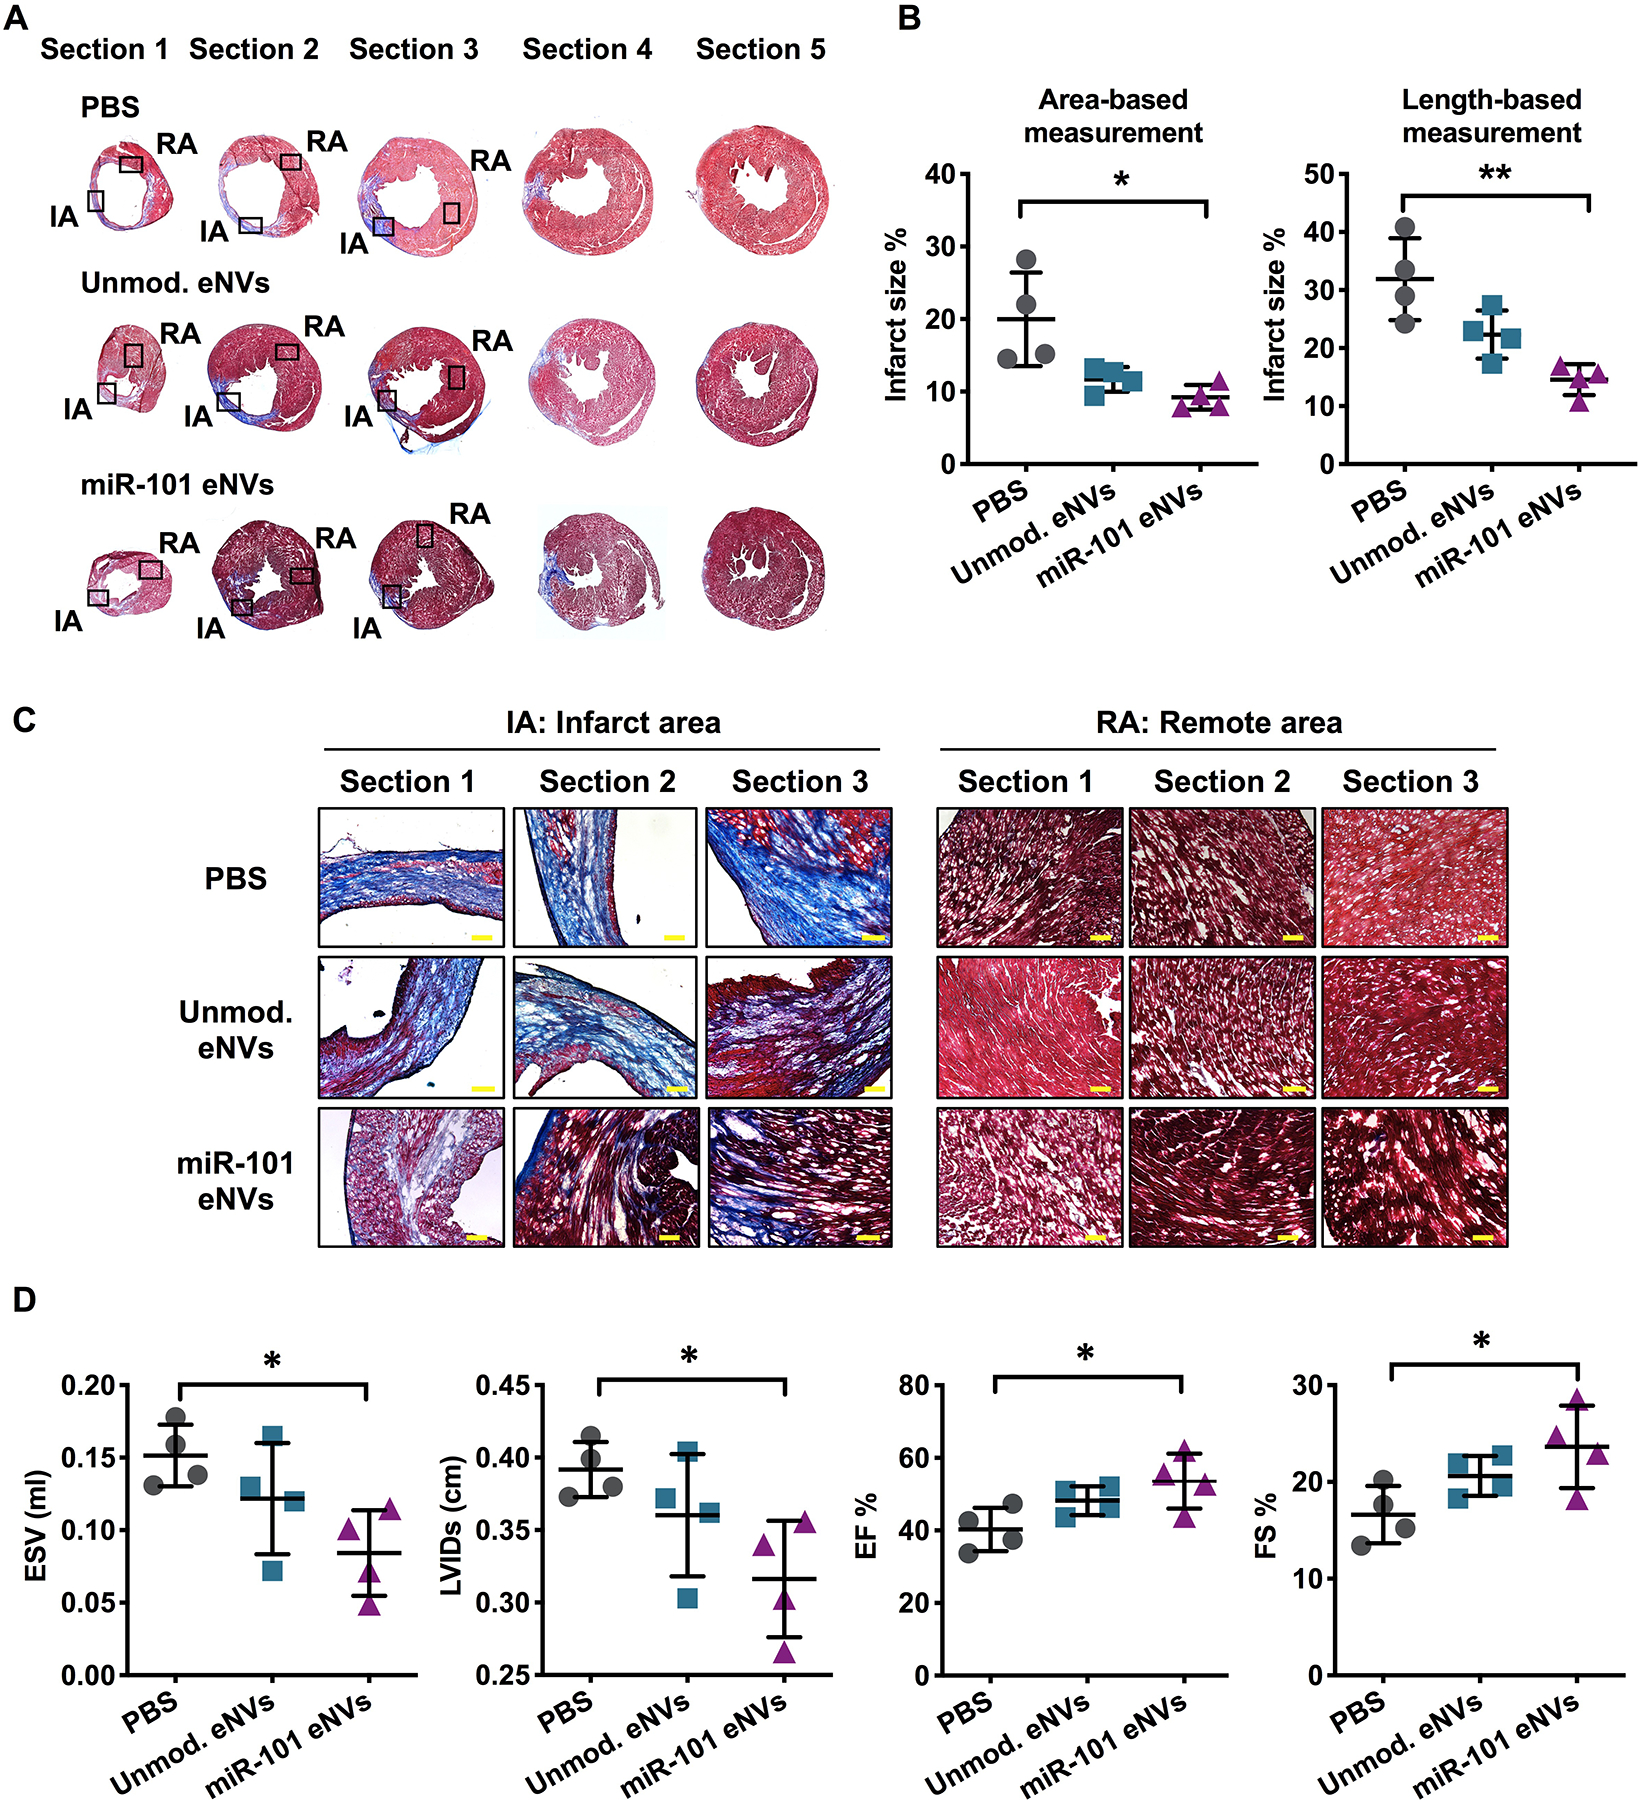
Figure 7.

Heart function and infarct size after MI. (A,C) Masson trichrome staining of representative cryosections of infarcted hearts. (B) Infarct area expressed as % infarct size by area-based measurements (infarct area/LV (%)) and length-based measurements (midline infarct length/LV midline length (%)). (D) Analysis of ESV, LVIDs, ejection fraction (EF%), and fractional shortening (FS%) after MI by echocardiography. Data are presented as mean ± SD with *p < 0.05, **p < 0.01 by one-way ANOVA followed by Tukey’s post-test, n=4. Scale bar = 100 μm.
