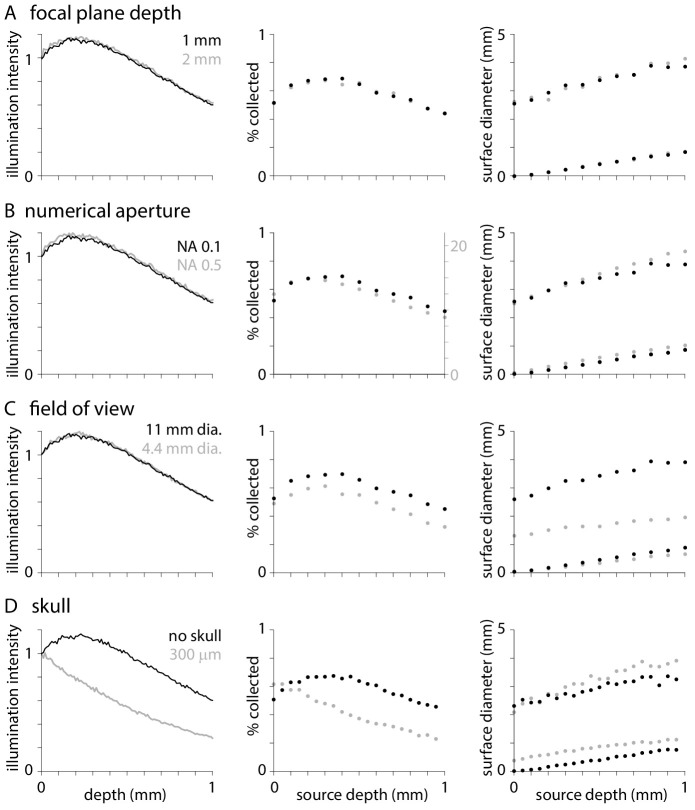
Figure 3. Effects of optical parameters on illumination and fluorescence collection.
Normalized illumination intensity (c.f.Figure 1A), percentage of photons collected (c.f. Figure 2B) and diameters that include 50 and 95% of surface fluorescence (c.f. Figure 2C) with the objective focused at depths of 1 and 2 mm below the tissue surface (A), with objectives of numerical aperture 0.1 and 0.5 (B), with objectives of 11 and 4.4 mm field of view (C), and when imaging through no and 300 µm of skull. In each plot, black symbols represent results with an objective with NA 0.1 and 11 mm field of view focused 1 mm below the tissue surface with no overlying skull. For collection efficiency, results from different numerical apertures are displayed on different y-axes to facilitate comparison.

