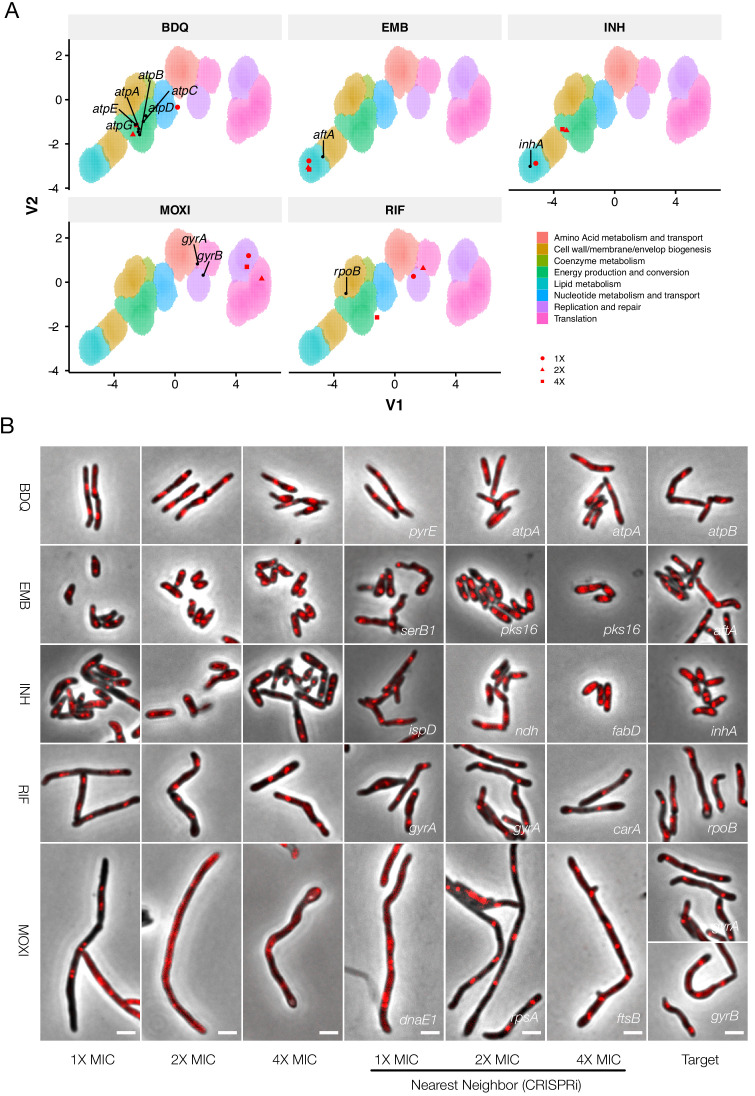
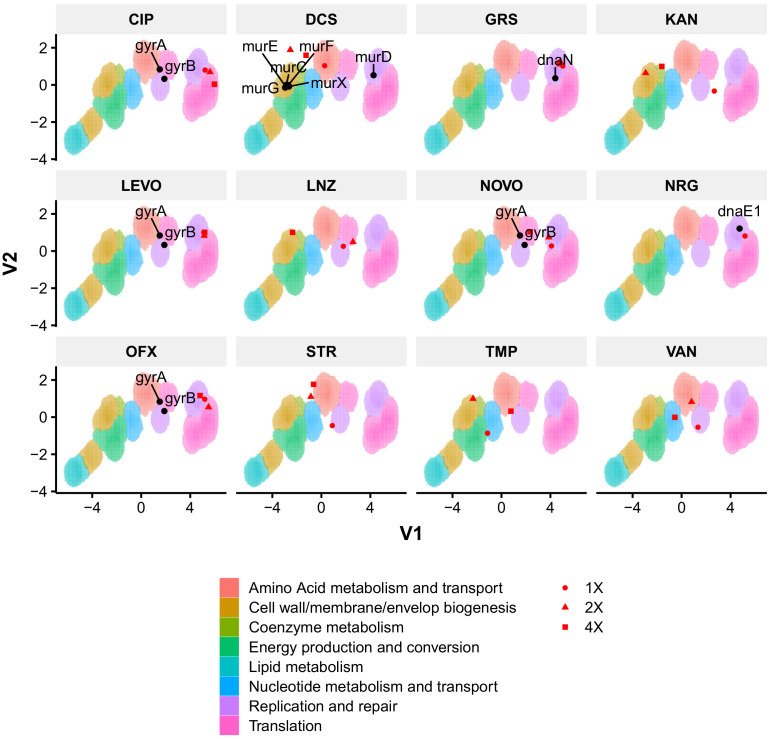
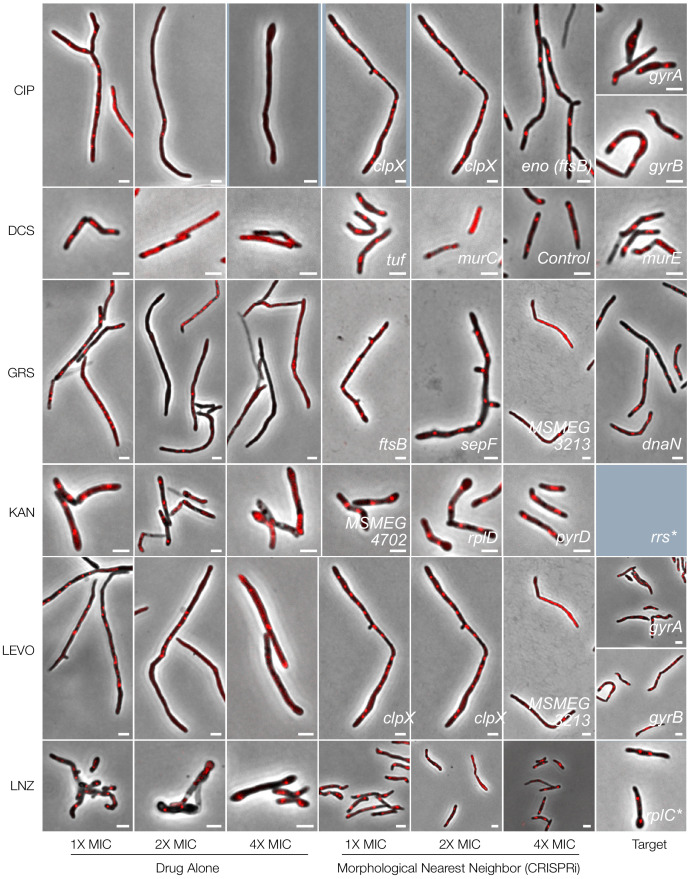
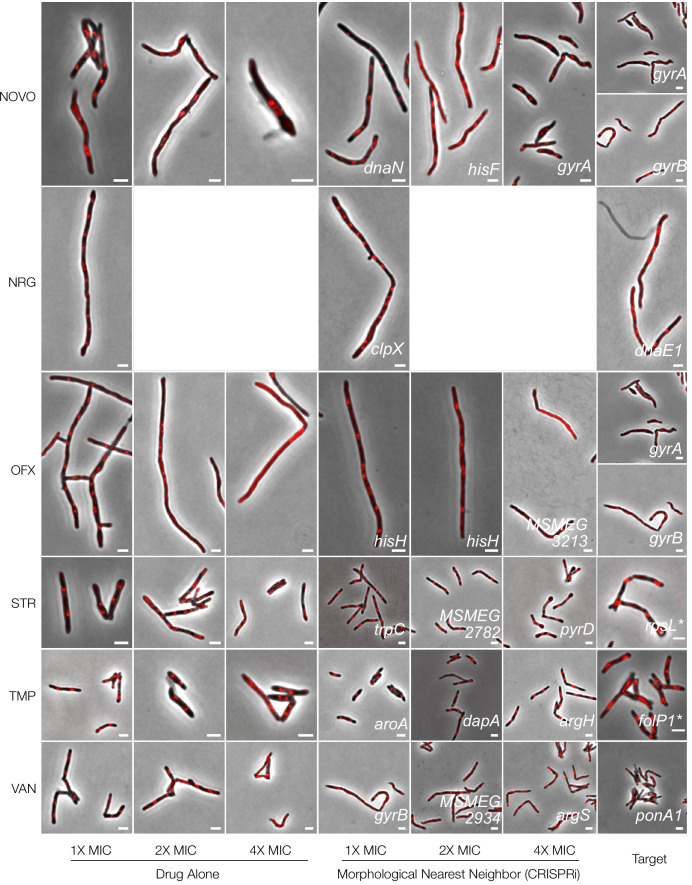
Figure 10. Phenoprinting can inform antimycobacterial MOA.
Cells were exposed to varying supra-MIC concentrations (1X, 2X, 4X MIC) of the selected antimycobacterial compounds for 18 hr, imaged, and analyzed using the pipeline developed for CRISPRi-imaging. The resulting profiles were visualized in CRISPRi-generated UMAP space (A), and the morphological nearest-neighbor identified (B). Known targets were simultaneously visualized for comparative purposes. BDQ, bedaquiline; EMB, ethambutol; INH, isoniazid; RIF, rifampicin; MOXI, moxifloxacin.


