. 2020 Nov 6;9:e60083. doi: 10.7554/eLife.60083

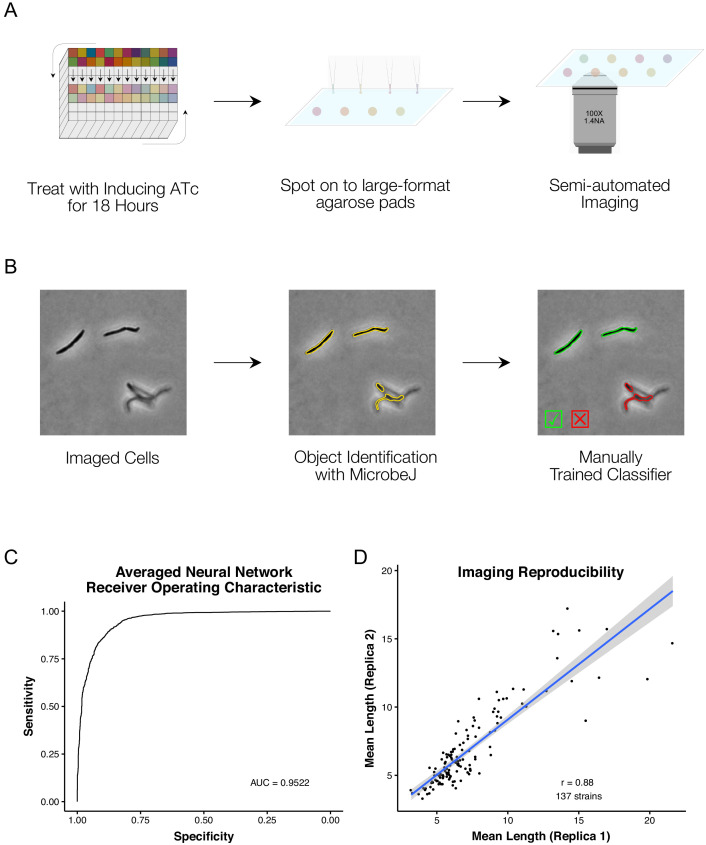
Figure 2. A high-throughput, quantitative CRISPRi-imaging pipeline for mycobacteria.

(A) Cells were exposed to ATc inducer for 18 hr before spotting onto large-format agarose pads for semi-automated imaging. (B) Image processing in MicrobeJ (Ducret et al., 2016) was combined with a manually trained Averaged Neural Network classifier to extract quantitative descriptions of bacterial morphologies and ParB protein localizations for 163559 cells across 263 gene-specific CRISPRi mutants and 27 empty vector controls. (C) Classifier performance was measured by Receiver Operating Characteristic (ROC) Area Under the Curve (AUC), returning good performance metrics. (D) Mean cell lengths were compared for 137 strains imaged as biological replicates on two separate occasions, and showed high reproducibility (r = 0.88, Pearson’s).

Figure 2.

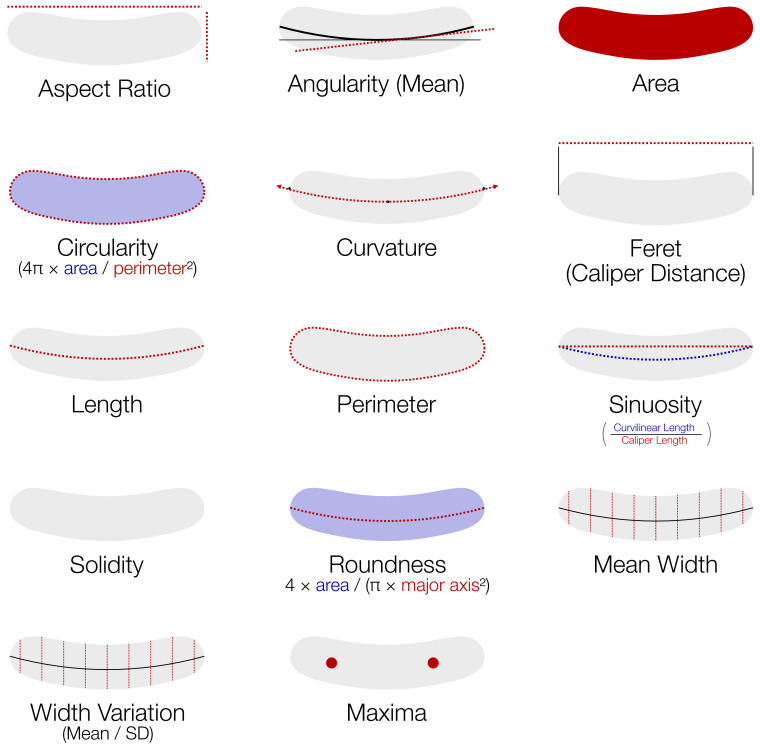
Figure 2—figure supplement 1. Features extracted by MicrobeJ (Ducret et al., 2016) and utilized in downstream analysis.

Figure 2—figure supplement 1.

Detailed descriptions of each feature can be found in the supplementary material of Ducret et al., 2016.
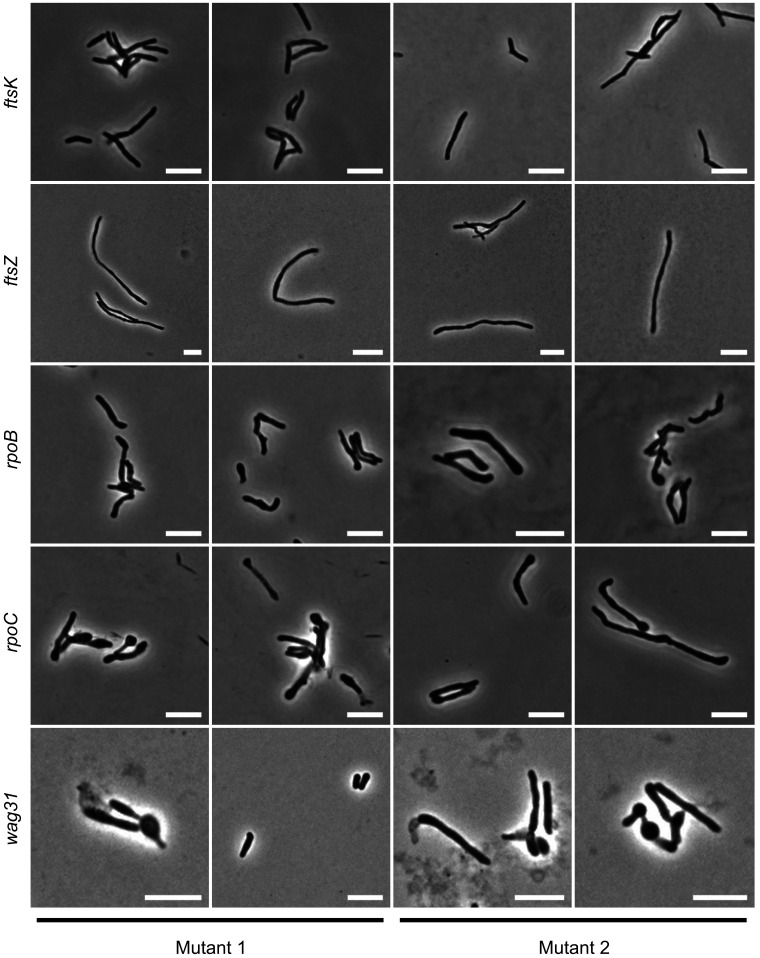
Figure 2—figure supplement 2. Consistency of phenotypes with varying sgRNAs.

Figure 2—figure supplement 2.

A selection of mutants present in the library (Mutant 1) were chosen and targeted with a second sgRNA (Mutant 2). Phenotypes were broadly consistent.
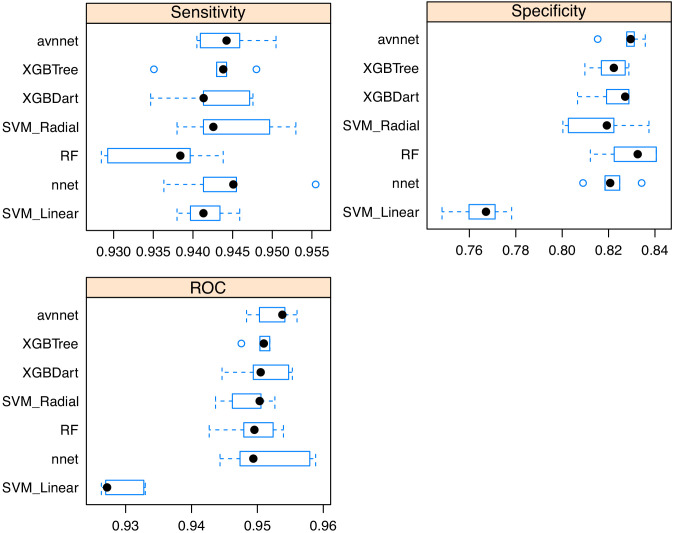
Figure 2—figure supplement 3. Comparisons of cell classifier models.

Figure 2—figure supplement 3.

Samples of the imaged library were analyzed with MicrobeJ and manually classified. A variety of models was trained using Caret, with fivefold cross validation, and tested on a reserved sample of the classified images. An averaged neural network was selected as the best performing model based on receiver-operating characteristic (ROC) area-under-the-curve.