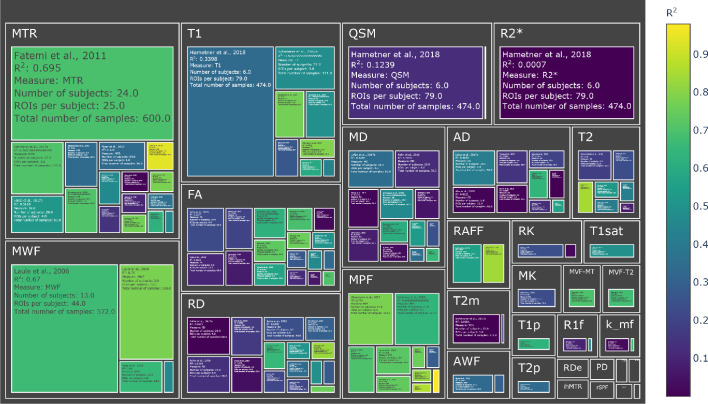
Figure 3. Treemap chart of the studies considered for the meta-analysis, organized by MRI measure.
The color of each box represents the reported R2 value while the size box is proportional to the sample size. To see the interactive figure: https://neurolibre.github.io/myelin-meta-analysis/02/closer_look.html#figure-4.

